Statistics
Overview
In EntryScape you can se statistics of the use of your published open data. This may be useful in your reporting and development work.
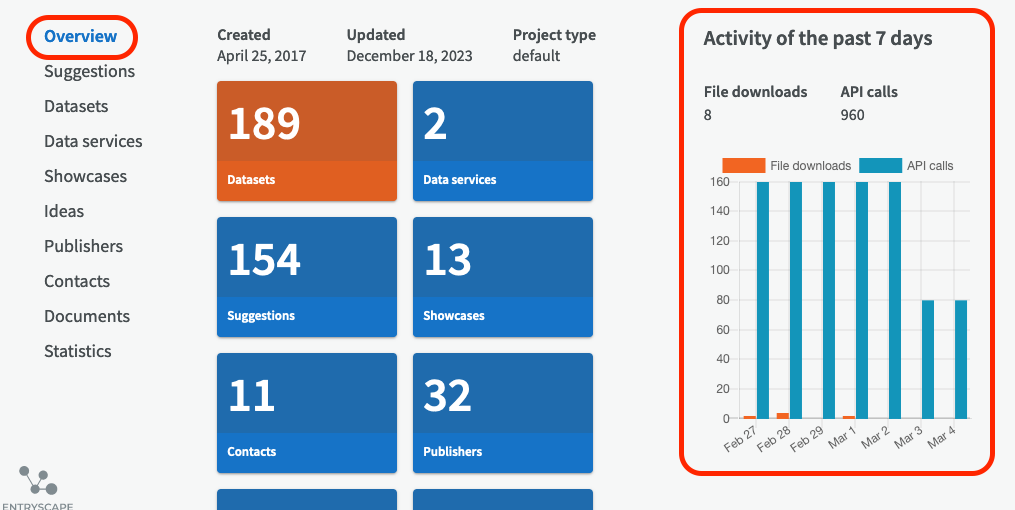
On the overview page for your catalog you will find a simple preview of usage activity at the bottom. It shows the number of file downloads and API calls for the last 7 days.
Detailed statistics
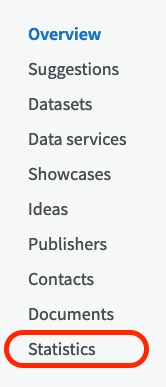
For more detailed statistics, go to Statistics at the bottom of the left menu. Depending on the amount of calculated datasets, it may take a few seconds for the statistics page to load.
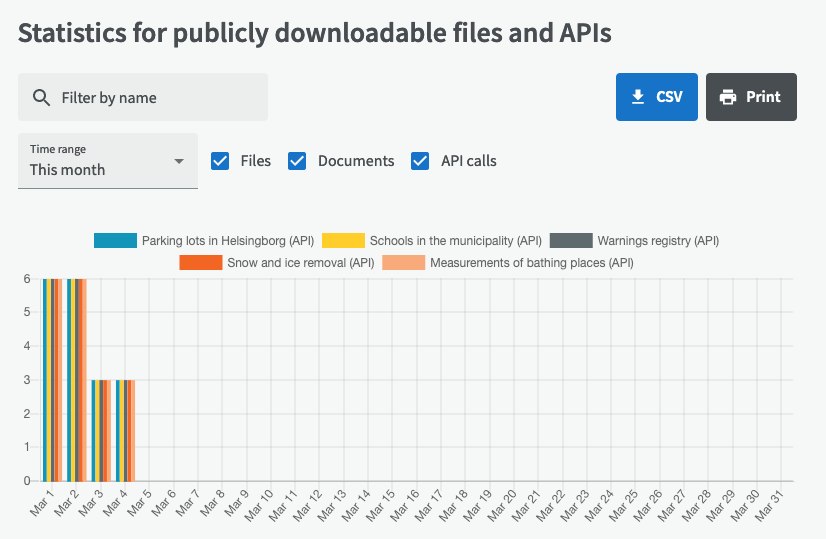
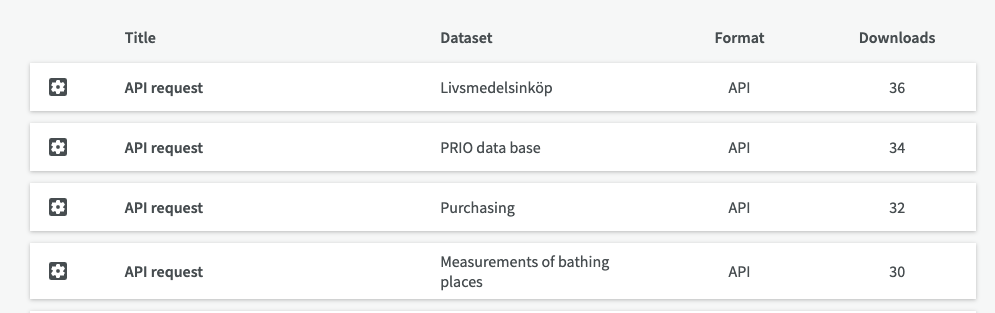
The detailed statistics shows number of downloads of APIs and files for different datasets during a chosen time range.
Filter statistics
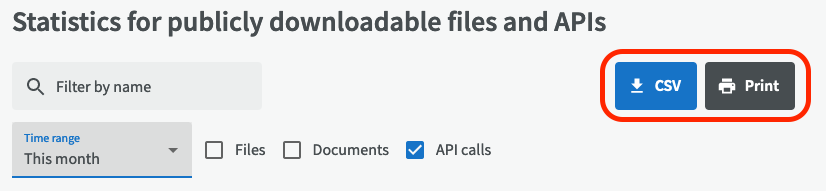
You can filter the statistics in several ways. You can search for the title of your dataset in the search box at the top. You can also select which time range you want to see (for example yesterday, last month, this year etc) and you can select which types of data you would like to see (files, documents, API calls).
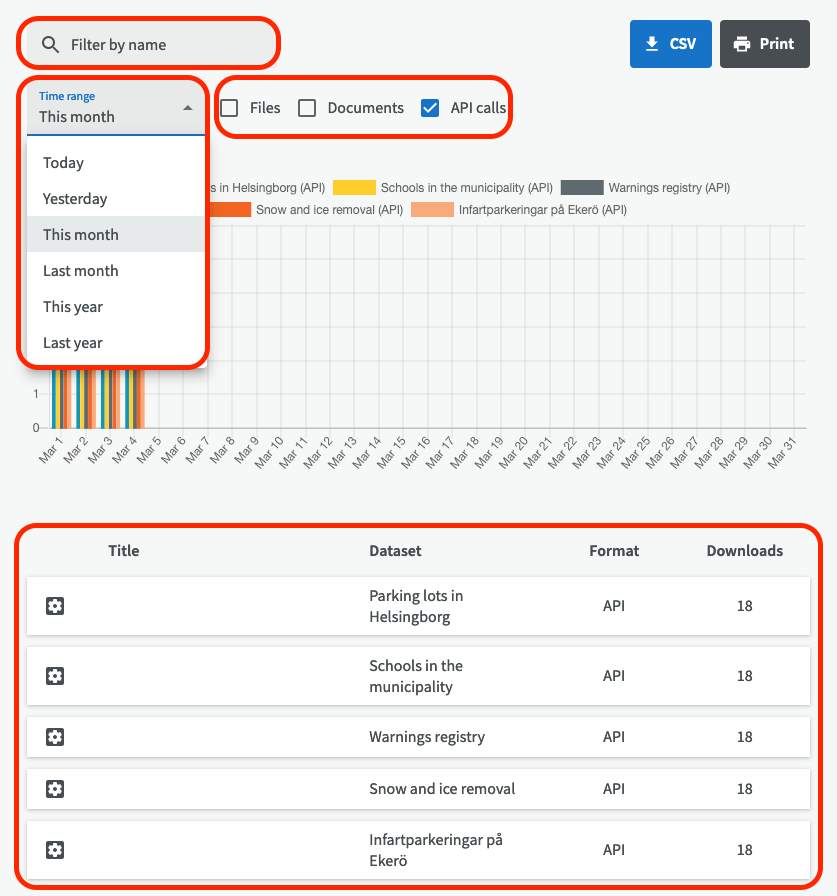
Below the diagram each entity is displayed on a single row. If you click on one row, only that entity is showed in the diagram. Click on the row once more to show all entities again.
Download or print
You can also download the statistics as a CSV file, or print it, by using the buttons to your top right.