Distributions
Overview
A distribution is a representation of a dataset. For example, a dataset can be available through both an API and as a CSV file at the same time, meaning that the dataset has two different distributions. There is no limit on the number of distributions per dataset, but there should not be more than one distribution with the same content and file format for a dataset. A distribution may however consist of several files in the same format, especially suitable for time series that are continuously updated.
Create distribution
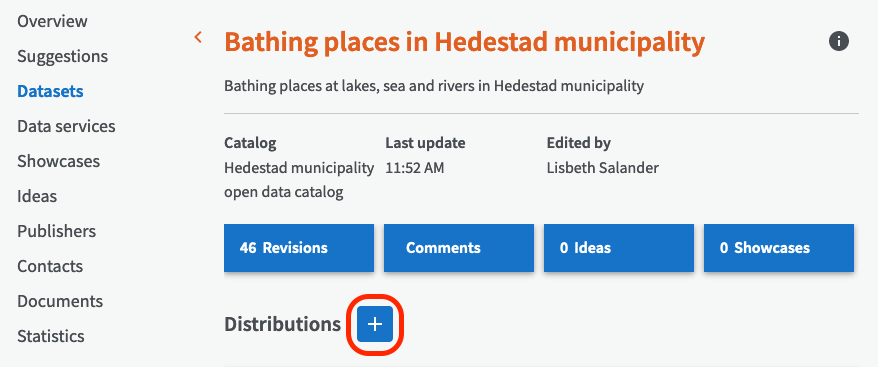
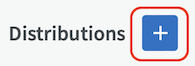
To create a distribution, go to the dataset overview page and click on the plus button next to Distributions. Then choose Create distribution.
If there is already a data service with a layer you want to use to create the distribution, select “Create distribution from a data service” instead.
If you have chosen to create a distribution in the usual way, you can then choose whether you want to enter a link (web address) or upload a file.
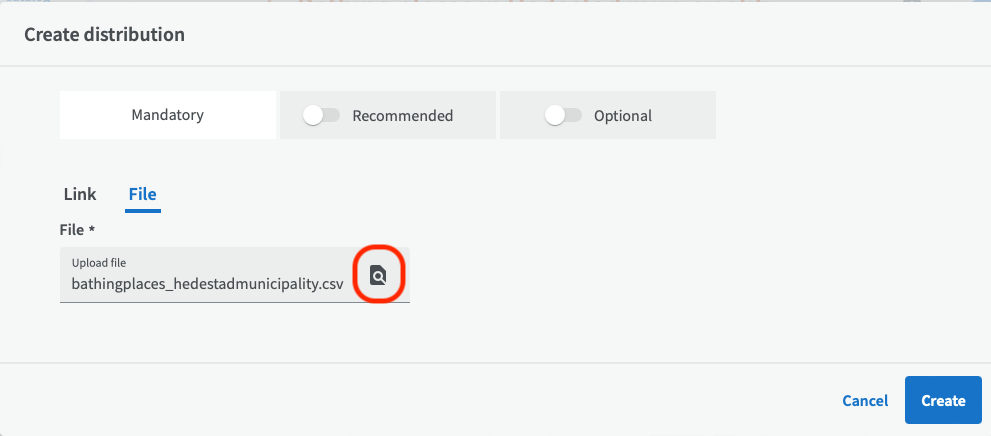
Upload a file
To upload a file, click on "File" and then on the magnifying glass. Max file size in 24 MB. If your file is bigger than that, we recommend that you split the data into several files. (There might be exceptions from this size limit, if you have an EntryScape Catalog Tailored solution.)
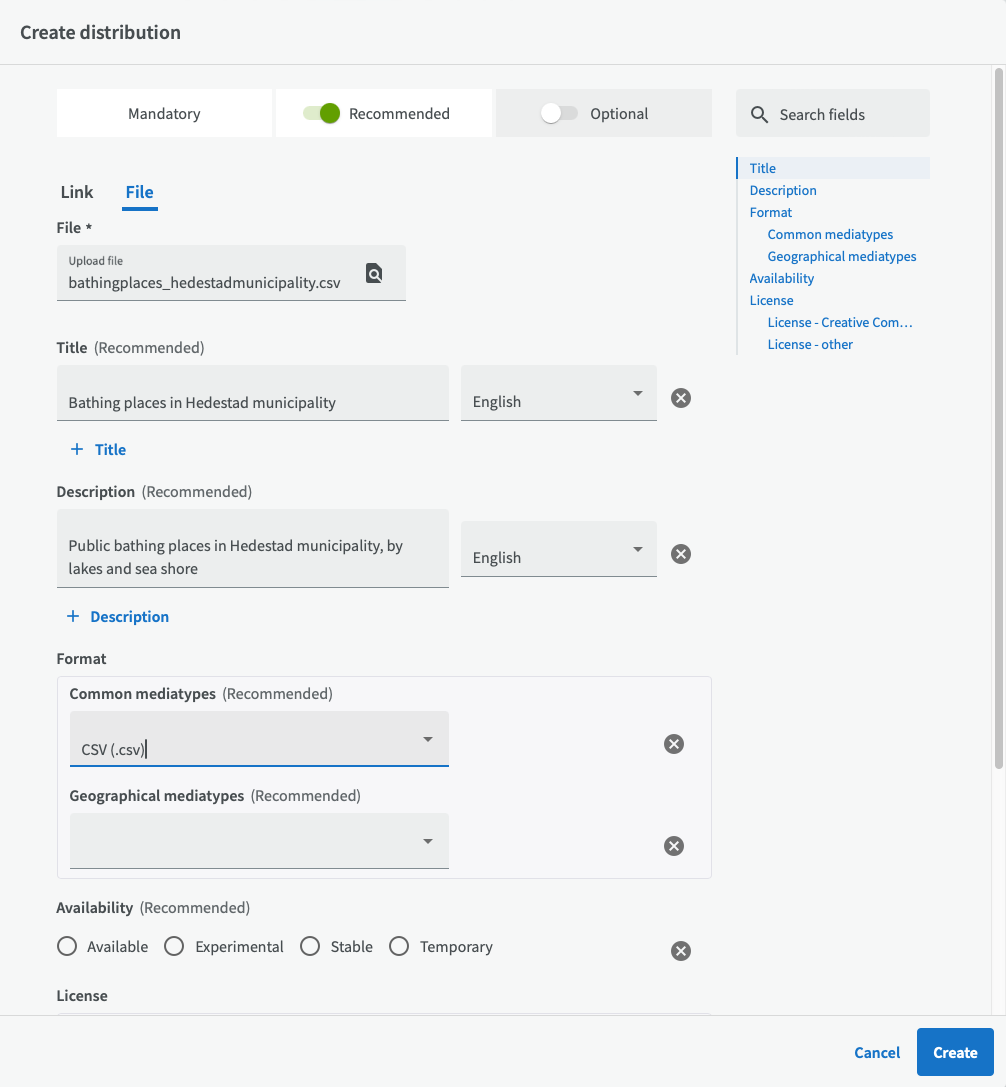
If you turn on recommended and optional fields, you get to describe the distribution in more detail. You can read more about some of the recommended and optional fields below. You can also click on the title for an input field to see a tool tip with short information about what information that is expected as input.
Some of the recommended and optional fields for distributions are described below. You can also click on the field titles
Recommended fields
Title: Name of the distribution. To add a title in another language, click on "+ Title". A new row with input fields will appear where you can choose other languages.
Description: A more detailed description of the distribution.
Format: Describe the format for your distribution. You can choose between "Common mediatypes" like CSV and JSON, or "Geographical mediatypes" like WMS or TIFF. If you can't find your file format in the list of Common mediatypes or Geographical mediatypes, turn on "Optional fields" to be able to enter other mediatypes.
Availability: Availability states how long the the data will be accessible. "Available" means that the data is accessible in the medium term (a few years). "Experimental" means that the data is accessible for a short time. "Stable" means that the data will remain accessible for a long time. "Temporary" means that the data can disappear at any time.
License: It is recommended to provide license information for the distribution. Choose the applicable license for the distribution, even if you have already described it for the dataset. Creative Commons Zero Public Domain 1.0 (CC0 1.0) is a common standard for open data and organizations. The license that the organization has chosen to work with is often explained in the organization's Information Reuse Policy document.
Optional fields
Temporal resolution: The minimum time period resolvable in the dataset, e.g. "Months: 3”.
Release date: Date when the distribution was created. With the date menu to the right, you can choose if you want to enter only a year, or a date or a date and time. Then you enter the year/date/time in the left fields.
Applicable legislation, High-value dataset: If the dataset is categorized as a high-value dataset. Make sure to also mark the dataset to which the distribution belongs as High-value dataset and choose a appropriate Category for it.
Attribution text: The text used in an attribution link, for example the name of a publisher or a group of contributors.
Attribution URL: The URL that should be used when attributing a data source, for example URL to the publisher homepage.
Copyright notice: The copyright notice associated with a rights statement. Typically displayed when acknowledging the source of the data.
Copyright statement: Link (URL) to a document that typically includes both copyright notice and guidance for re-users.
Copyright year: The year from which copyright over the content of the dataset is asserted.
Copyright holder: A reference to the organization that holds the copyright over the content.
Jurisdiction: A reference (URI) to the jurisdiction in which copyright and/or database have been asserted, usually a country or a region.
Guidelines for re-users: Link (URL) to a document that provides guidelines for re-users that is covered by a specific rights statement.
Checksum value: A lower case hexadecimal encoded digest value produced using a specific algorithm.
Algorithm: The algorithm used to produce the checksum. Currently, SHA-1 is the only supported algorithm.
Documentation: A page or document about this distribution.
Linked schemas: An established schema that the described distribution follows. If you use linked schemas, they should be used as a complement to formats (media types) where you provide more information about the distribution's data structure. Typically, this is an XML schema, JSON schema, or API description (e.g., in accordance with the OpenAPI specification). Sometimes it may be appropriate to specify an ontology, data model, or profile. Note that if what you specify is format-independent, it may be better to use the “Conforms to” field at the dataset level.
See detailed information
If you want to see more detailed information about your distribution, click on the information icon.

Then you get a popup dialog where you can see metadata such as web address for access, metadata URI etc for your distribution as well as all entities linking to or from your distribution. Read more about detailed information.
Edit distribution
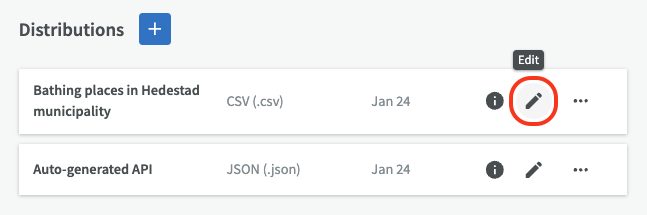
You can edit the distribution by clicking on the edit pen.
Remove, replace or update file
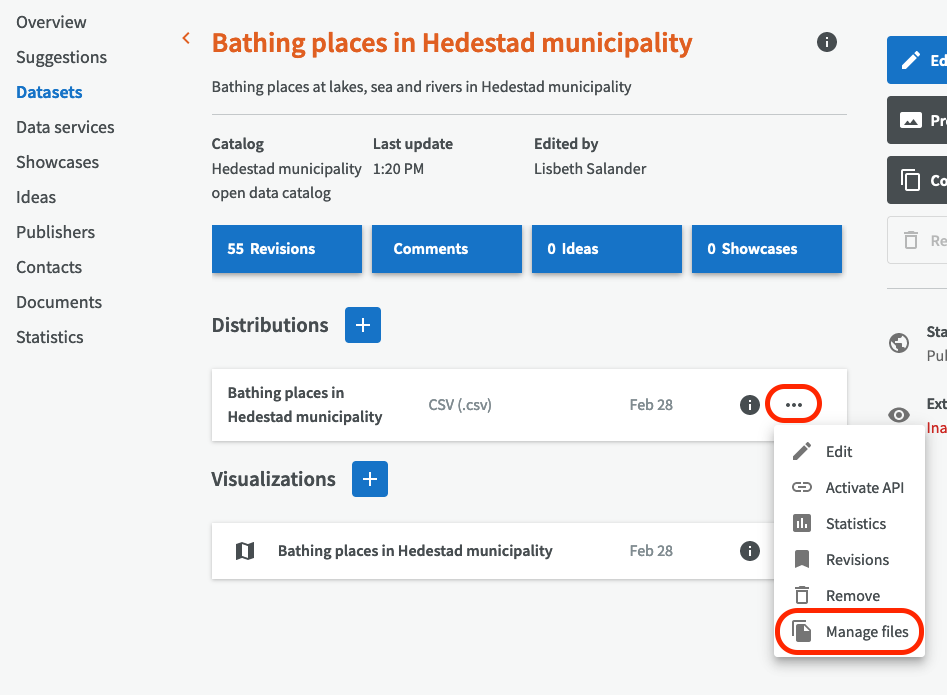
To manage the files belonging to a distribution, go to Distributions, click on the three-point menu and select ”Manage Files”.
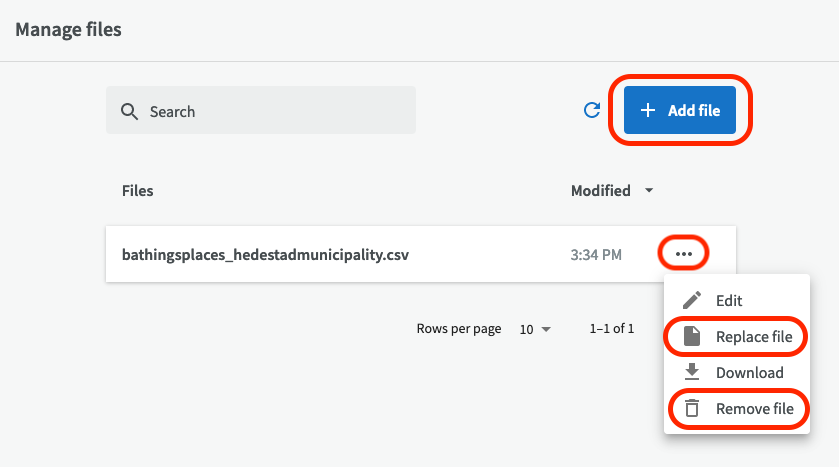
On the distribution overview page you can choose to replace or remove an existing file. You can also add a new file (for example data for a new year).
Don't forget to keep the metadata description updated, so it always matches the uploaded files. ”Date modified” is an optional but useful input field for distributions.
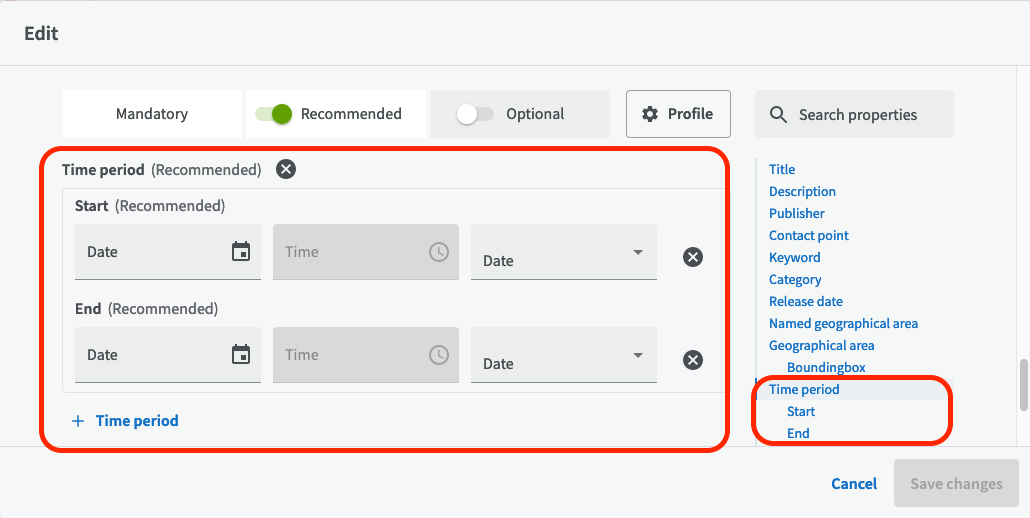
You can also go to Datasets and choose "Edit" to change the recommended field ”Time period” to match the time period in the data for the new file.
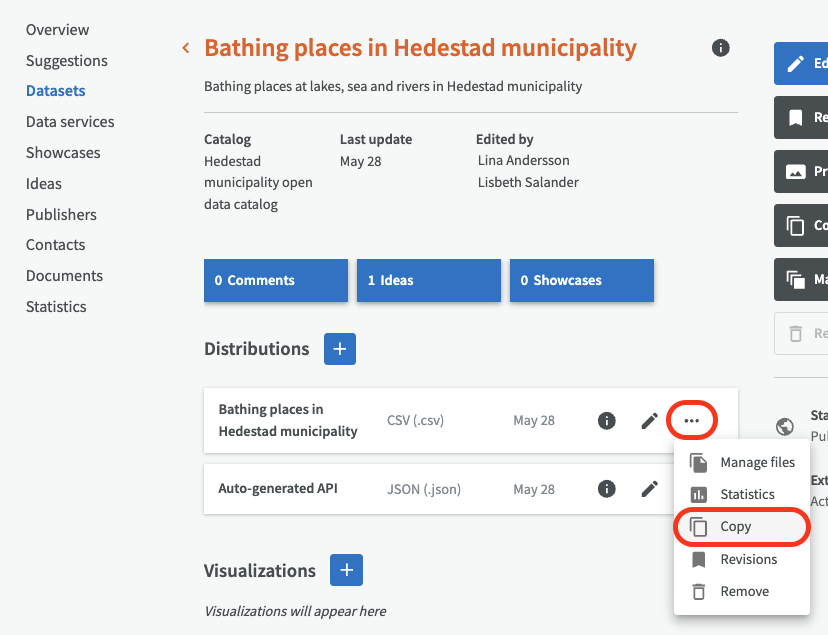
Copy distribution
If you want to make one or several copies of a distribution, without having to fill in all the metadata again, you can click on "Copy" under the three-point menu for the distribution.
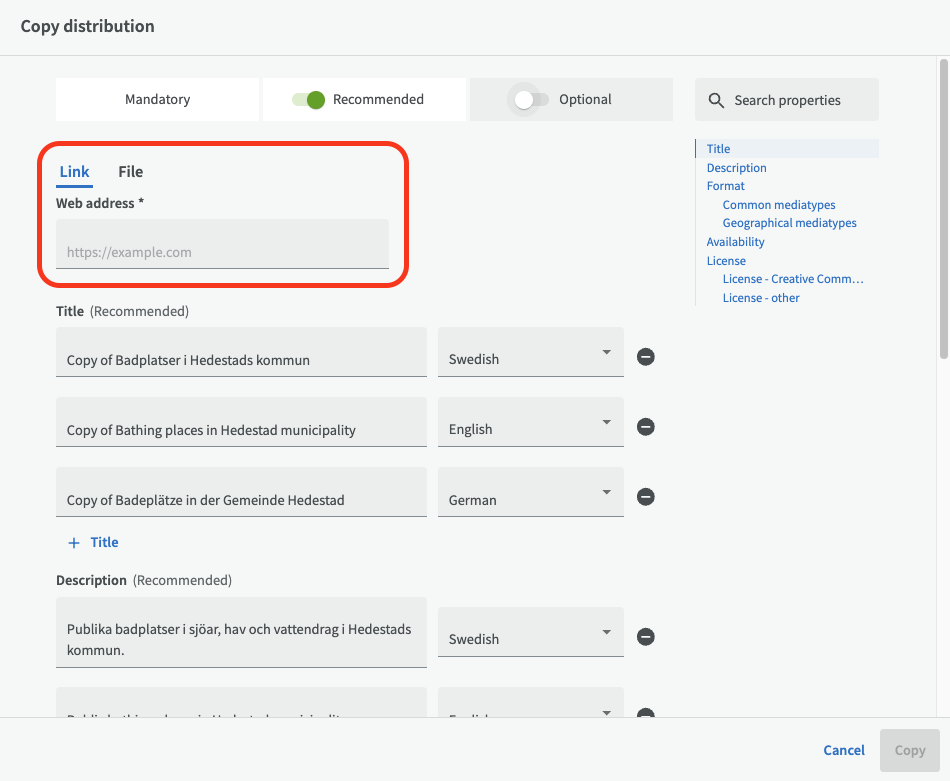
This will copy the metadata of the distribution and you will have the option to choose whether to upload a new file or provide a new link to the data. It is therefore possible to change the format of the new copy of the distribution.
Create an API using tabular data (CSV)
A distribution with tabular data (currently CSV files) can be used to automatically create an API.
There are a few conditions that must be met for the API generation to work:
- The first row of the table should contain short names for each column as they are used as variable identifiers in the API. The column titles will be trimmed and converted to lower case on import.
- String values such as column titles or cell contents may only contain Unicode characters.
- Commas (
,) must be used as column separators. Detection is available for CSV files that use semicolons (;) as separators, but it is recommended to use commas. - Double quotes (
") must be used as quotes. - Double backslash (
\\) must be used as escape character. - Line feed (
\n) or carriage return followed by line feed (\r\n) must be used to indicate a new line.
An automatically generated API is available via its REST interface and a simple web interface can be accessed with a web browser. The web interface contains links to more detailed Swagger-based API documentation.
Activate API for a distribution
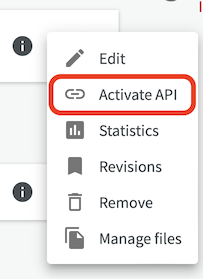
It is beneficial to enable the API for a file distribution if possible. If you have uploaded a file as a distribution, you can enable it for use through the API. To do this, go to the dataset overview and click on the three-point menu on the right side of the distribution, then click Activate API.
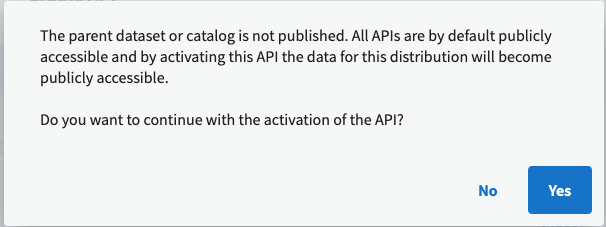
If the dataset is not published, the following warning will appear that the dataset will be published when you start activating API generation. If you are OK with this, click "Yes".
Then the API generation begins.
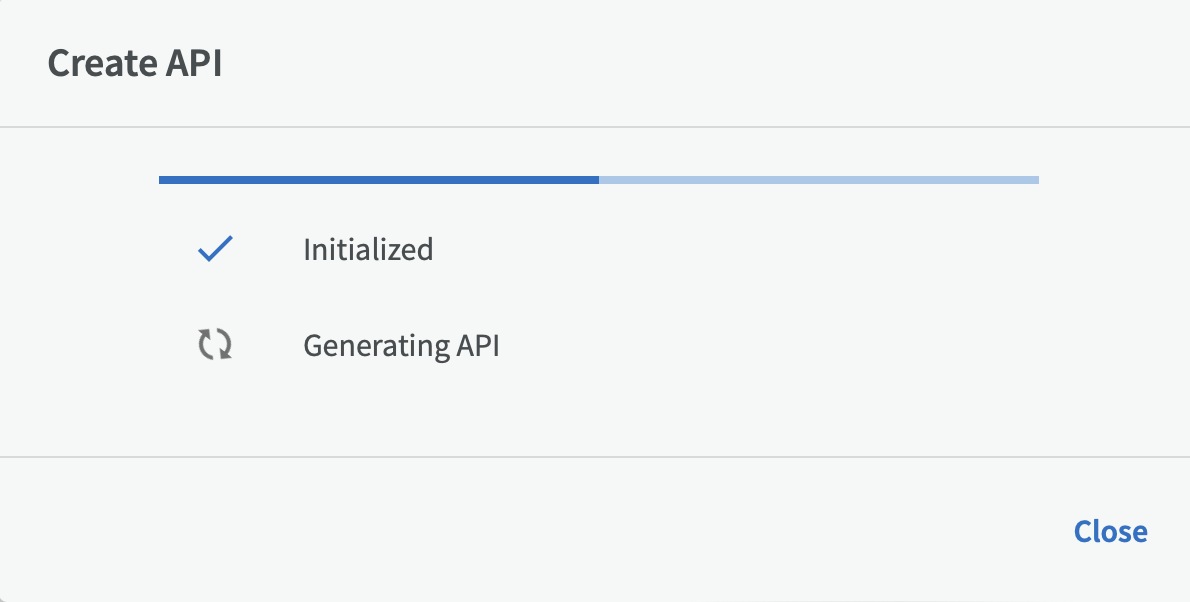
Once the API has been generated, click Close.

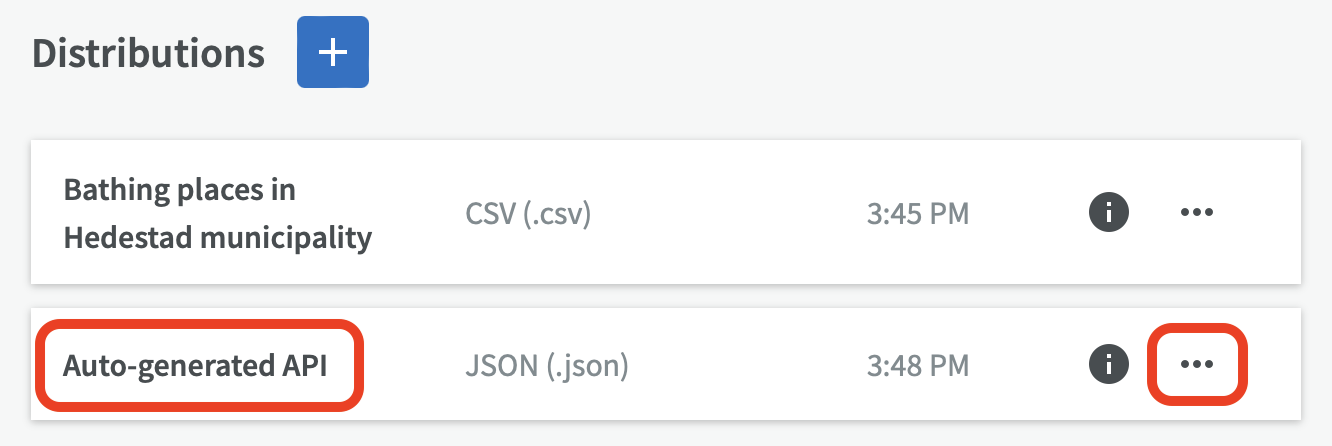
Your new API now exists as a distribution named "Auto-generated API" in JSON format. Click on the edit pen if you want to rename it. Using the three-point menu, you can see the API information (URL for the API), remove the API or - if you have made changes in the original distribution (CSV file) - choose to update the API to include the new changes.
Link to external API:s or files
If an external API already exists, or an external file belonging to the dataset described in EntryScape, you can link from your dataset to the file or API, as an external distribution. (The external system is responsible for updates of its files and API:s, unlike if you would have created a distribution by uploading your own file in EntryScape.)
To link to an API or external file, click on the plus button next to "Distributions".
Then enter the external web address, starting with "http" or "https" and ending with for example ".json". Then you click on "Create".
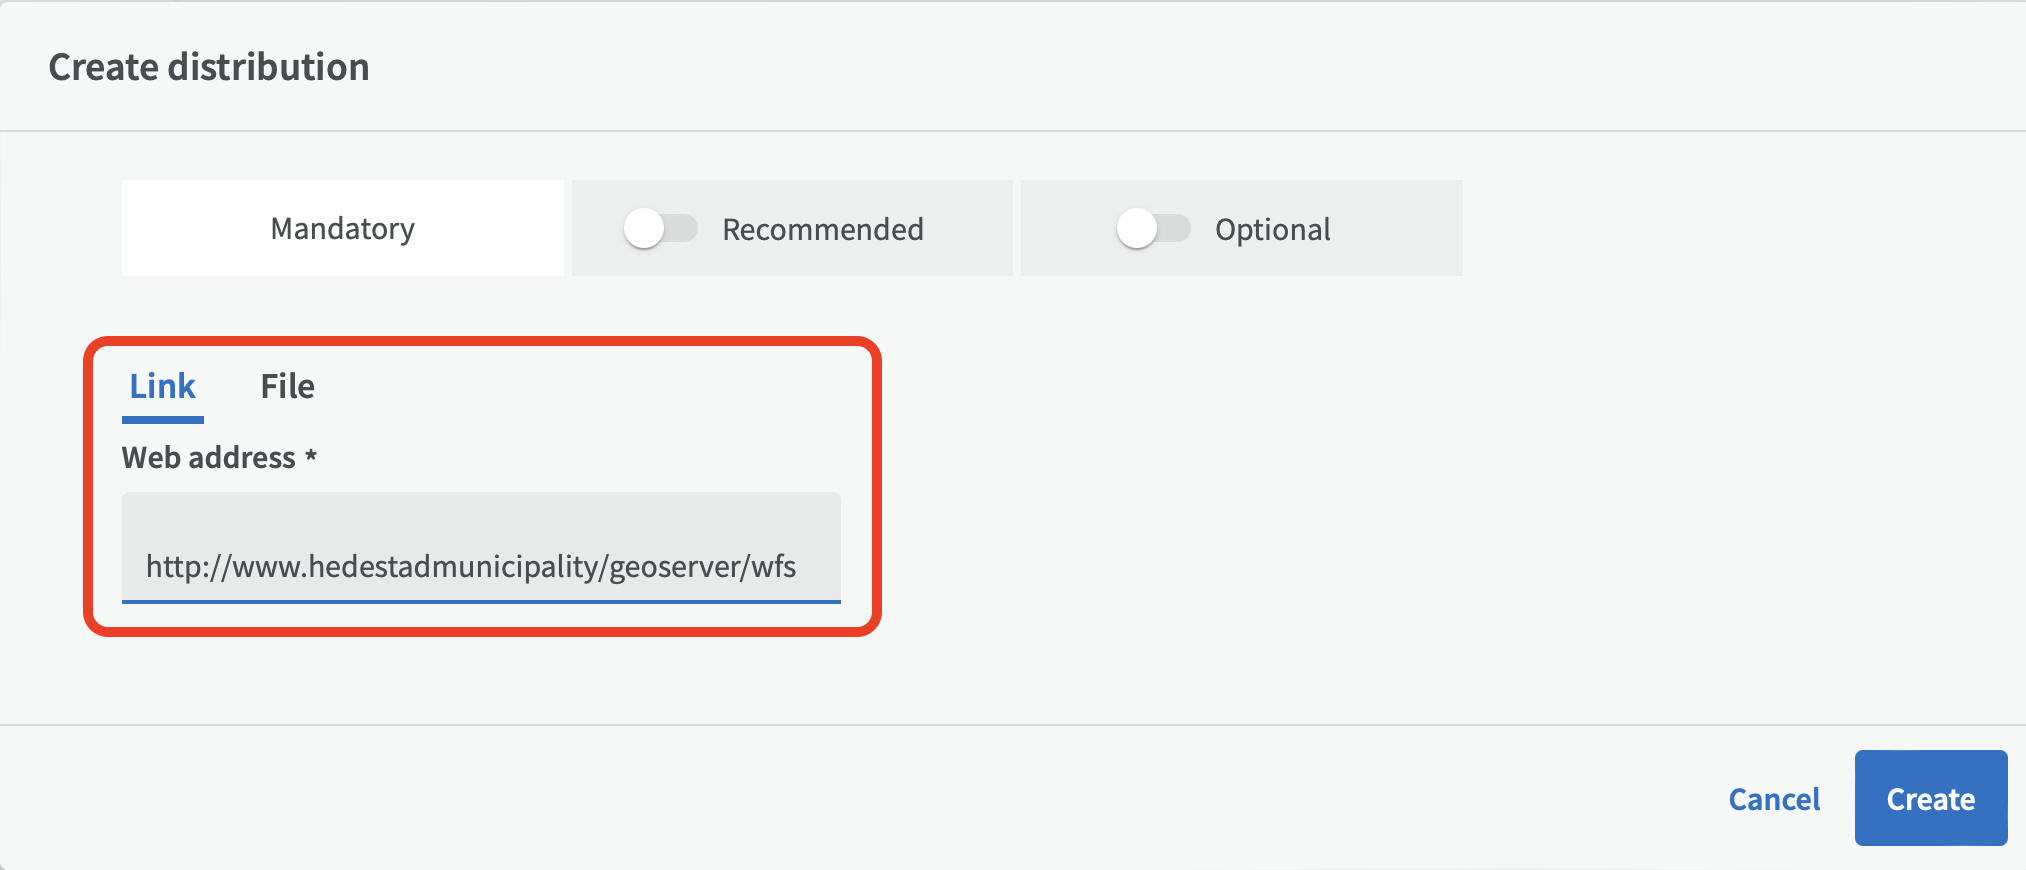
This creates an external distribution with the temporary name "Access point”.
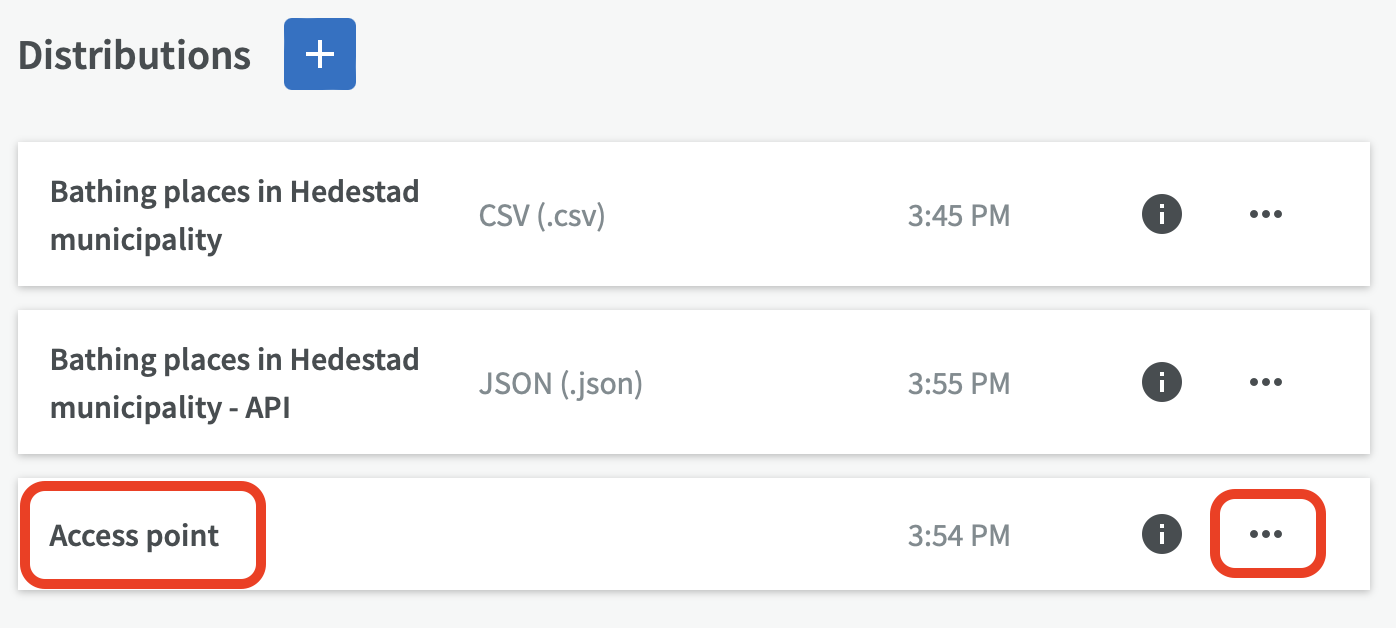
You can click the edit pen to change the name and describe the distribution better to easier distinguish it from other distributions. Enter a title, description and preferably also the file format, accessibility and license.
Visualizations
You can create visualizations of your data in EntryScape in the form or bar charts, pie charts, line charts, maps and tables. If you also use EntryScape Blocks to show the visualizations externally, your visualizations will automatically become added or adjusted in Blocks after your changes.
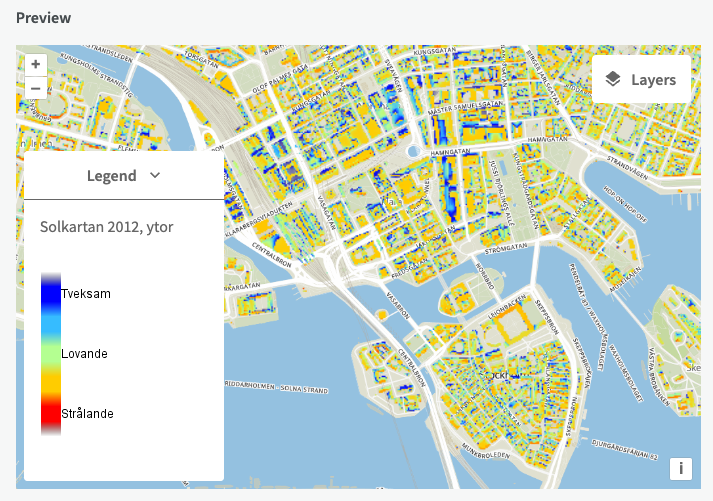
Map example: Old Town in Stockholm. Roofs with suitable solar input for installing solar cells.
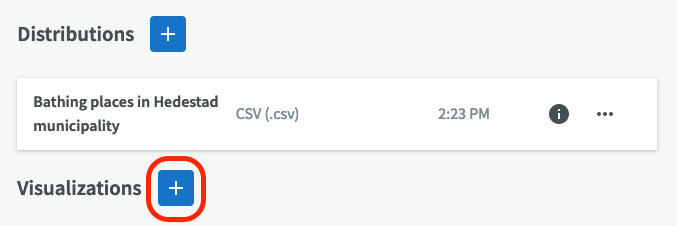
To be able to create a visualization, there must be a distribution with an uploaded CSV file or Web Map Service (WMS). Click on the plus button next to Visualizations to create a new visualization.
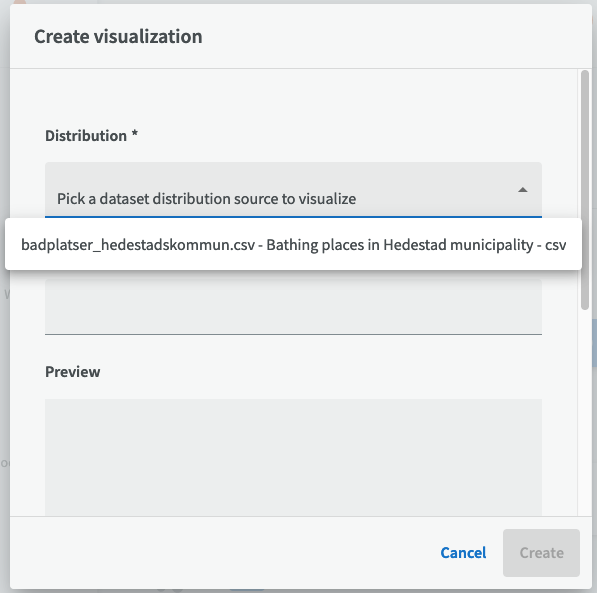
Then select distribution to create the visualization from.
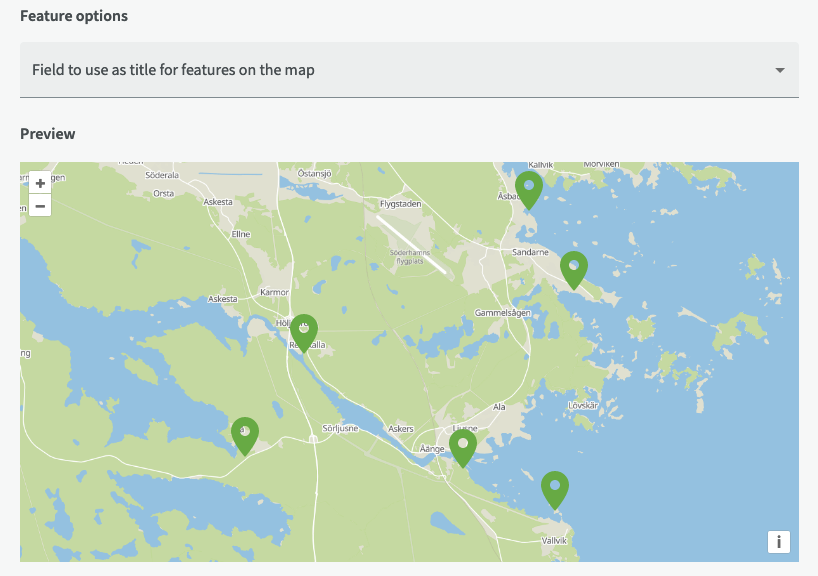
After that, describe the visualization by filling in the mandatory fields Title, Chart type and Chart axes. To be able to create a map visualization, there has to be geographic coordinates in your data file or WMS service.
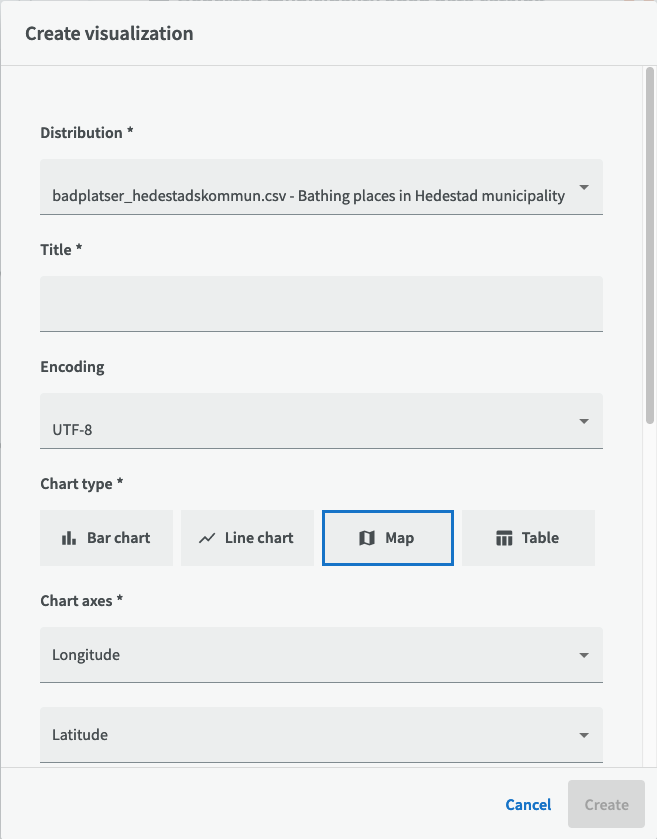
When the mandatory fields have been filled in, you can see a preview of the visualization at the bottom in the same window.
Note! If you see strange characters in your visualization, there is probably a mismatch between the encoding of the uploaded file and the encoding chosen in EntryScape. You can try changing encoding in EntryScape until the preview looks OK. If it's a big file, it's a good idea to check several pages and not just the first page, to notice single strange characters.
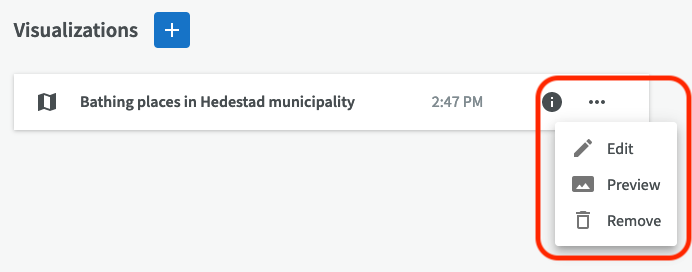
You can edit, preview and remove visualizations through the three-point menu.