Datasets
Search for dataset
Before you create a new dataset, it's a good idea to first check that it doesn't already exists. You can search among existing datasets in the catalog, by entering at least three characters in the search field.
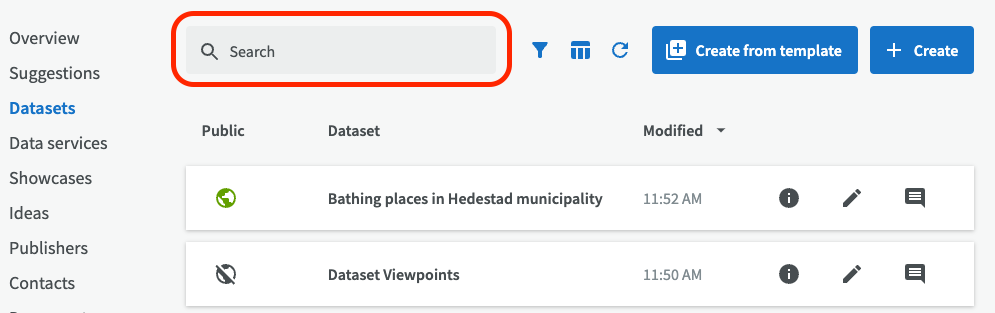
If the dataset doesn't already exist, you can create a new one.
Search filter
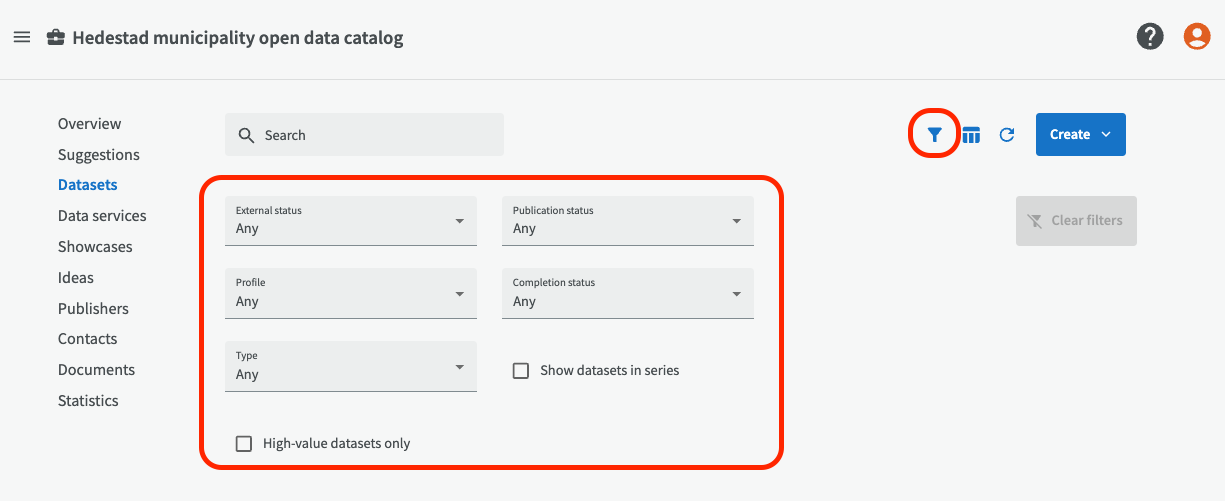
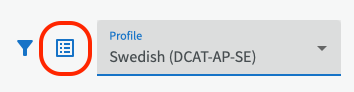
You can also use the filter function to filter on e.g. internally or externally published datasets, and published or unpublished datasets. Activate the filter by clicking on the filter icon at the top right.
Create a dataset from scratch
There are two different ways to create a dataset, either by creating it from scratch or creating it from a template that already exists.
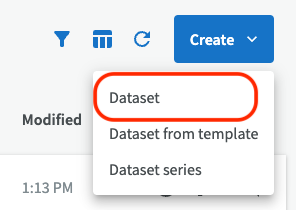
If you want to create a dataset from scratch instead of using a template, click on the button "Create" and then choose "Dataset".
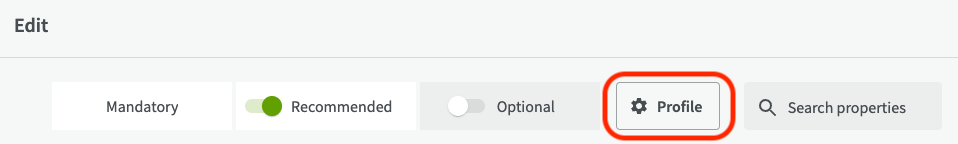
Start by choosing a profile that suits your dataset before you enter information in the input fields. If you can't see a profile button, the profile is already chosen for you. The profile you choose determines which set of input fields your dataset will have. The most common profile is usually the prechosen standard.
The organization can publish data according to different application profiles. For PSI data it can be DCAT-AP-SE and for INSPIRE it can be a combination of NMDP and DCAT-AP-SE. If you are working with geospatial data, you should use the INSPIRE profile.
By turning on recommended and optional fields you can describe your dataset in more detail. For more information about each input field, see Describing a dataset below.
Create dataset from template
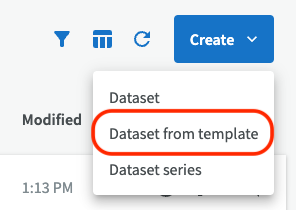
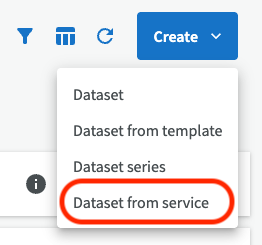
To create a dataset from a template, click on the ”Create” button, then select "Dataset from template"
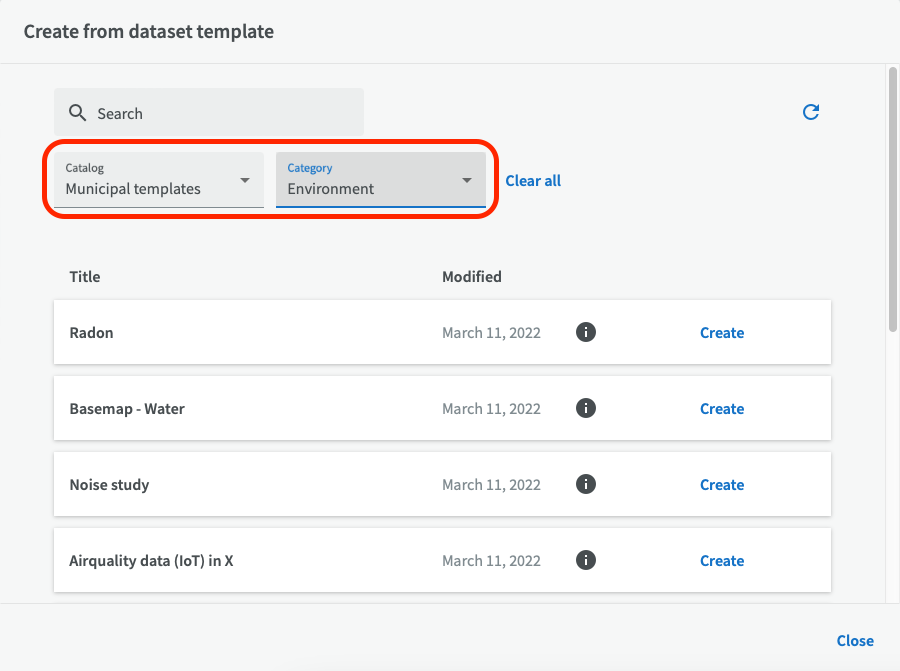
Then choose a suitable catalog and possibly a matching category (for example "Environment") where there might be a useful template for the dataset you want to to create.
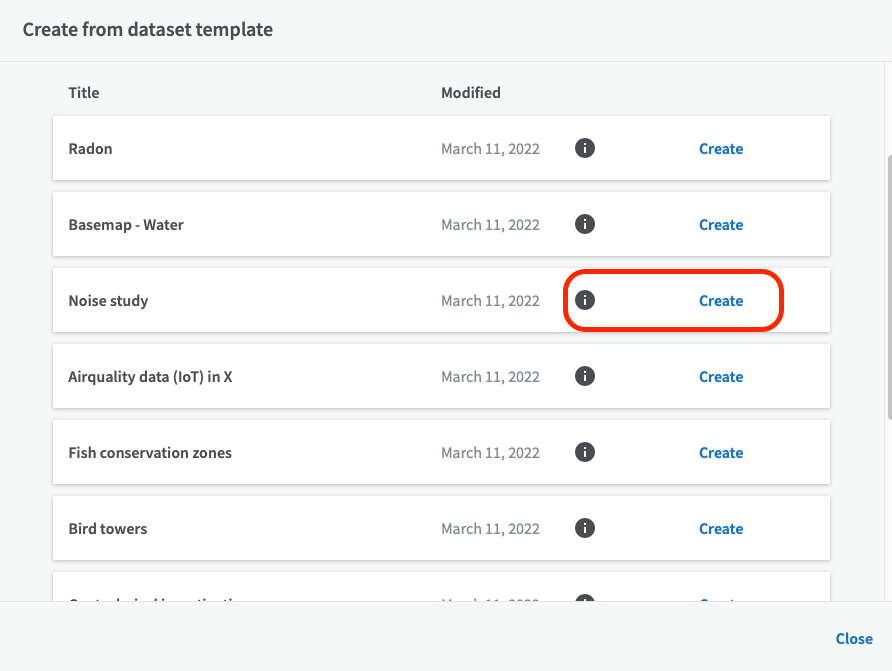
To preview the dataset description, click on the round information icon. If you want to use the chosen template, click on ”Create”.
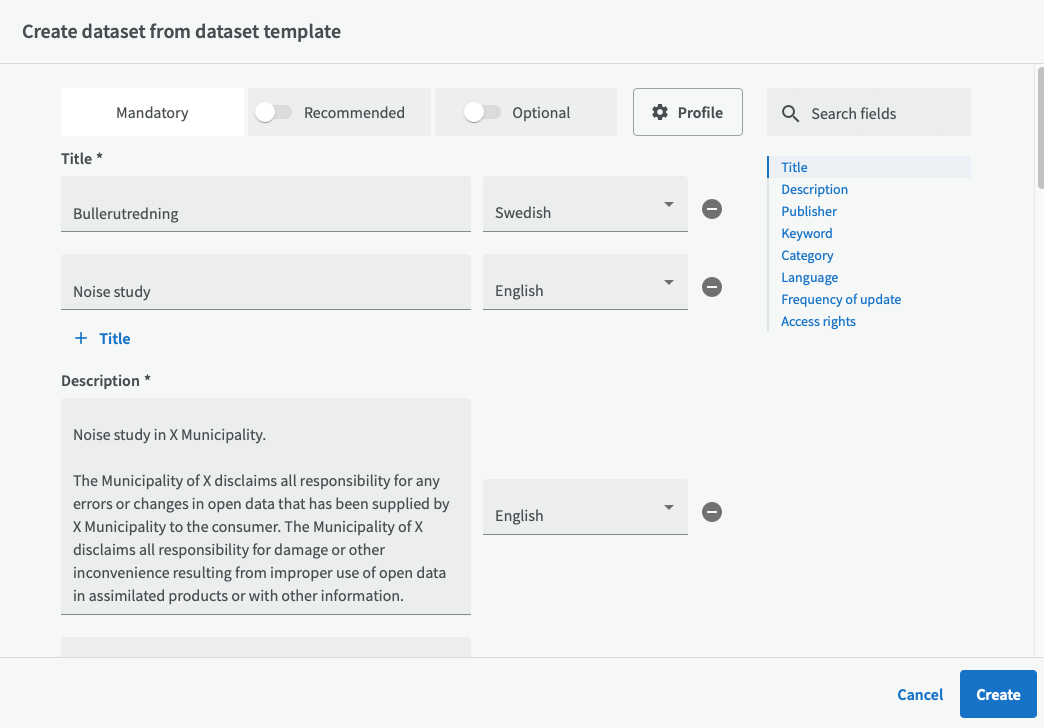
You will get a page with pre-entered information from the template that you can edit to suite your dataset.
You can only create one dataset from one template, but if you want to create several similar datasets, see Copy dataset.
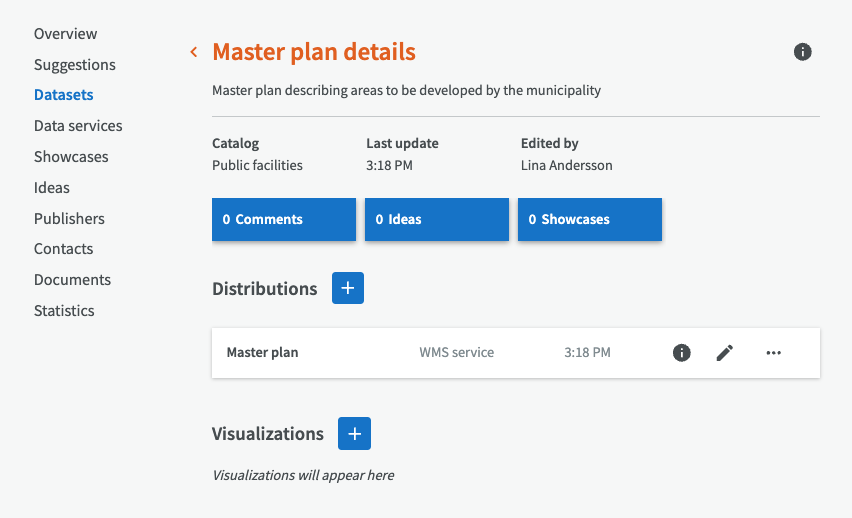
Create dataset from data service
Starting with version 3.17 of EntryScape, you can create datasets based on data services, initially WMS services (for maps).
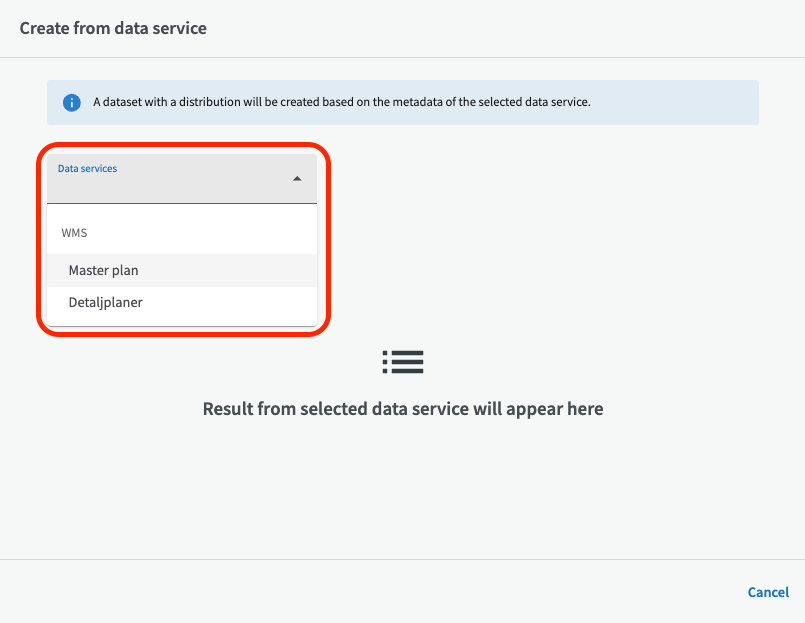
Start by selecting the data service you want to use. Please note that the data service must already be entered in EntryScape in order to be selected. If you do not see any data services here, you must first add the data service.
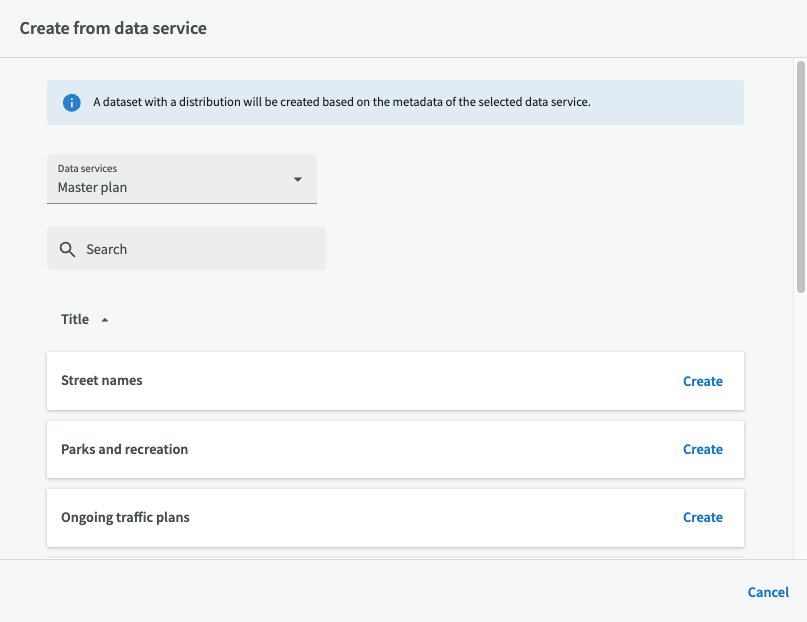
Once you have selected an existing data service (WMS), you can choose which layer you want to base the dataset on. Then click on "Create."
Then fill in metadata about the dataset, such as title, description, publisher, etc.

Finally, a dataset has been created based on a layer from a WMS service. At the same time, a distribution has also been created, and it is also possible to create a visualization of the dataset.
Describing a dataset
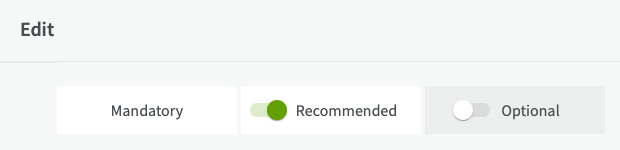
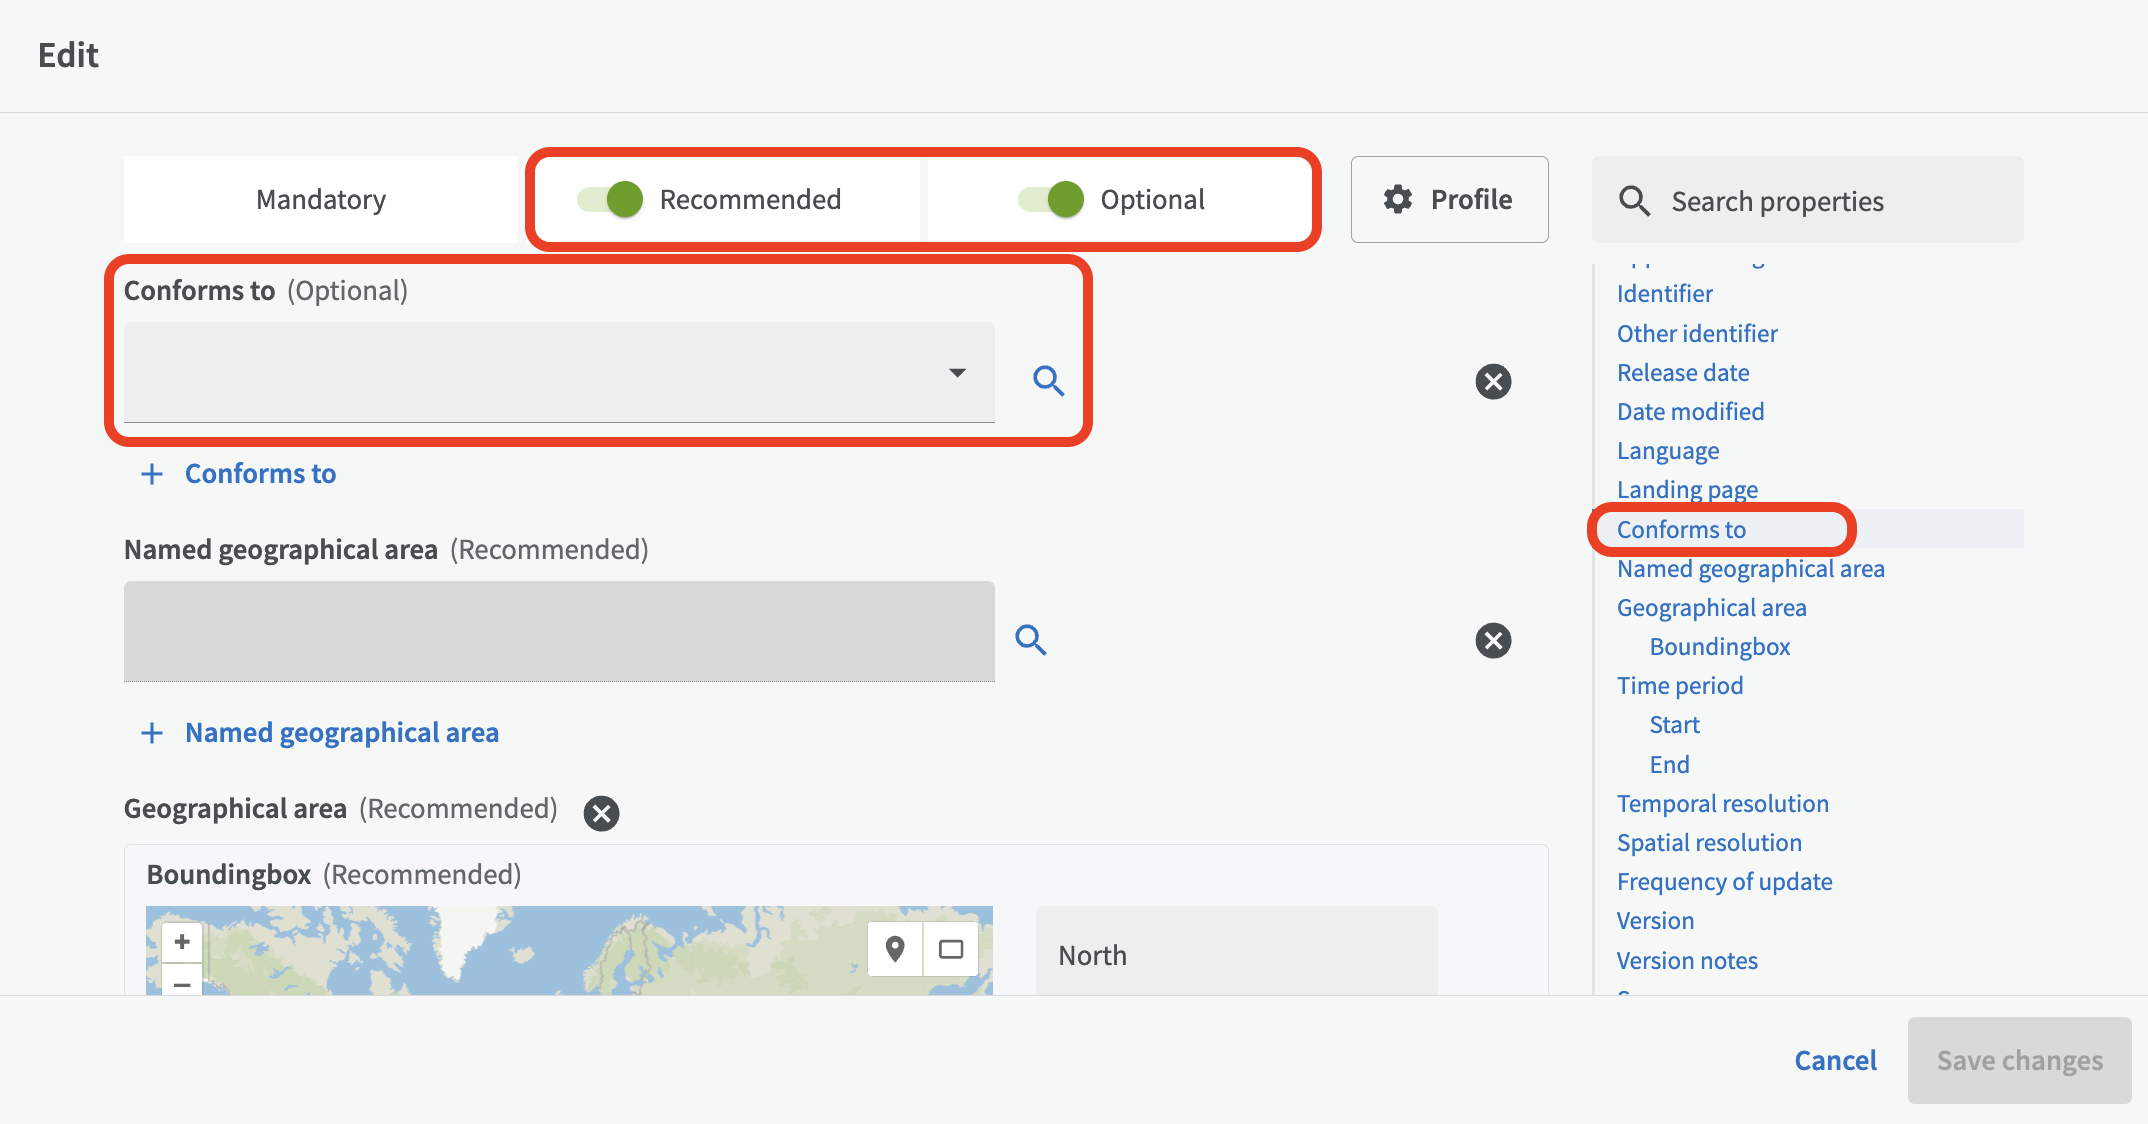
When you have chosen an appropriate profile you can start describing your dataset. All mandatory and recommended input fields are shown by default. You can choose to show or hide the recommended and optional input fields on the edit page by using the slide buttons at the top. Input fields already containing data are always shown.
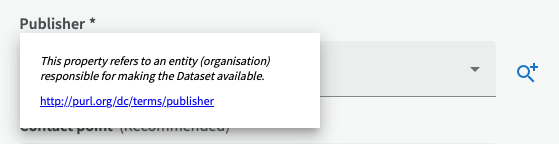
On the right side you see quick links to all the input fields. If you click on the title for an input field, you will get a field explanation with a short description of what input is expected and in some cases links to DCAT-AP or other corresponding explanations.
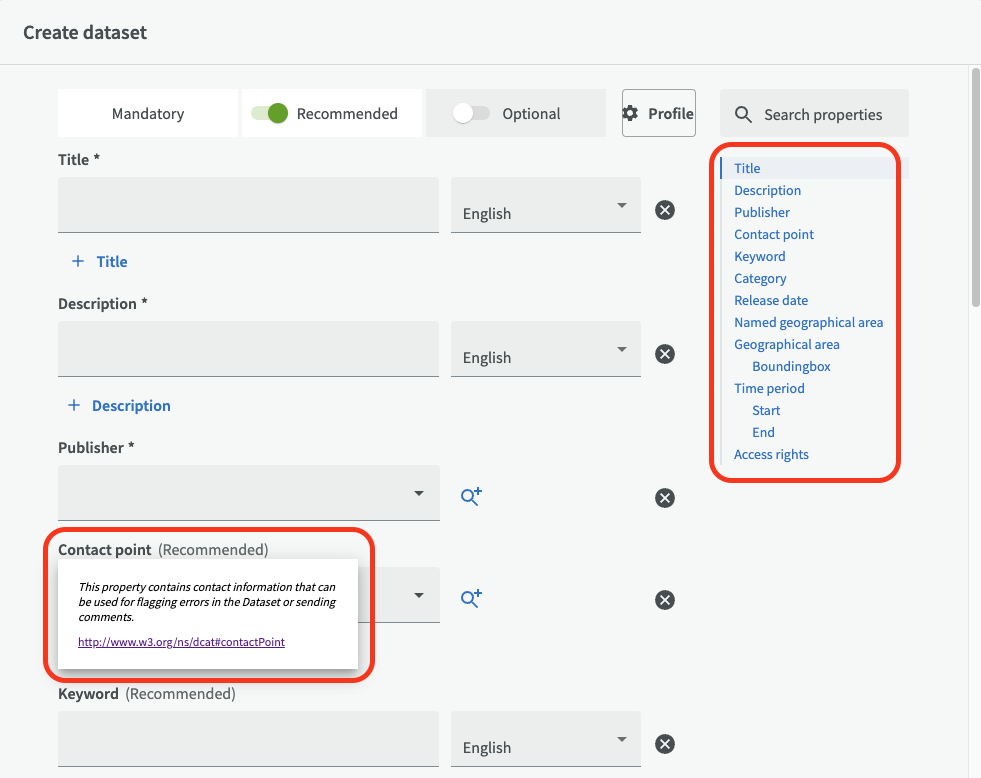
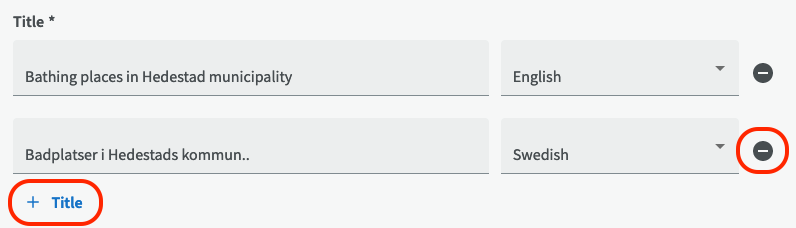
The three fields: Title, Description and Publisher are mandatory fields for a dataset. Remember that your organization may require you to enter information in mandatory fields in more than one language. To add a title in another language, click on "+ Title". A new row with input fields will appear where you can choose other languages. If you instead want to remove a row, click on the minus symbol on the right side.
Note! If an external part hosts the dataset for an organization, that organization should be entered as publisher for the dataset. The reason for this is that the original organization can only set up rules on how the external host should handle the data, but in reality can't enforce control over the data.
Drafts
It is possible to save the description of the dataset even if you have not filled in all the required fields. It will then become a draft and it's easy to share it with colleagues even if it's not finished.
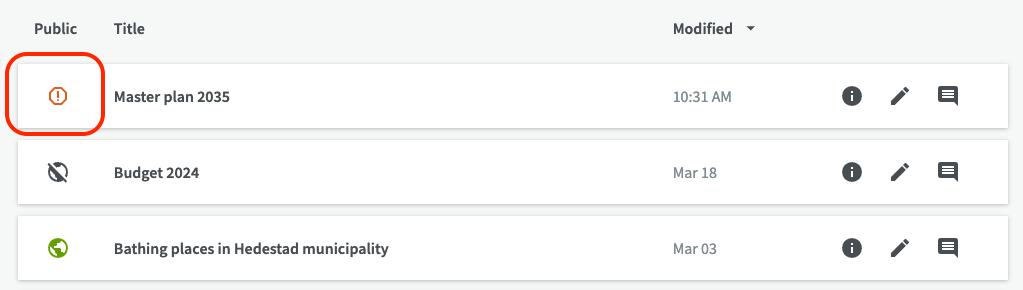
The draft will appear in the list of datasets with a red warning symbol indicating that it is an incomplete dataset and it will not be possible to publish until all required fields are filled in.
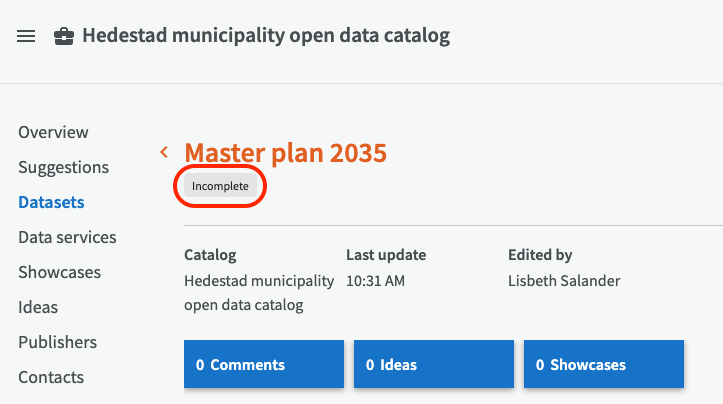
On the dataset overview page, it is shown with the tag "incomplete". When the mandatory fields are filled in later, the red warning symbol and the "incomplete" tag automatically disappears.
Some of the recommended fields and the optional fields for the profile DCAT-AP-SE are described below. If you want more information about the fields for DCAT-AP-SE, you can read more about it at dataportal.se.
Recommended fields
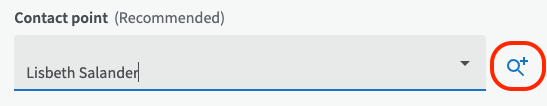
Contact point: A dataset needs a contact point, usually the data owner, in order for the organization to keep track of which department or person that updates and maintains the dataset. It may be an individual or an organization (department or unit within the organization) with a functional mailbox.
Choose a contact from the list or create one by clicking on the magnifying glass. For more information on how to create a contact, se Create contact point.
Keywords: To make the dataset searchable, and thus discoverable, you need to describe it by defining keywords, categories and subject terms (e.g. via linked or imported terminologies such as GEMET from the EU). Filling in the various fields may require some thought and work but they are very important to make it possible to find the datasets, both in your own catalog but also in other catalogs that harvest your catalog (e.g. dataportal.se, govdata.de or opendata.swiss).
Describe the dataset with your own keywords, one per line without commas. Create a new row with the plus sign (+).
Special case, Custom fields: In some cases there may be custom fields that your organization have in their specific profile. These are only available in your own instance of EntryScape and not in EntryScape Free.
For example, your organization may have chosen to import controlled subject terms from the GEMET (GEneral Multilingual Environmental Thesaurus) glossary into EntryScape. GEMET is an established European thesaurus with over 40 themes (top level) and contains a total of about 5000 terms. As there are so many terms to choose from, the easiest way to select appropriate subject terms is to use the search function.
Custom field from Inspire application profile: If your organization has a custom application profile for e.g. INSPIRE. If you have selected the Inspire profile, the Inspire Theme and Subject Category fields are also visible to describe the dataset.
Release date: The formal publication date for the dataset. With the date menu to the right, you can choose if you want to enter only a year, or a date or a date and time. Then you enter the year/date/time in the left fields.
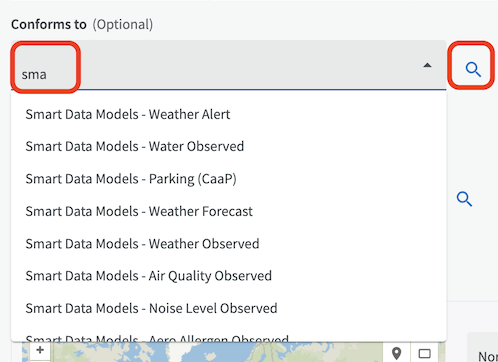
Conforms to
The "Conforms to" field is used to refer to a specification or implementation rule that applies to the dataset. (If the dataset belongs to a dataset series, the dataset series should also refer to the same specification as its datasets via the "Conforms to" field.) Depending on whether you are running DCAT 3 or DCAT 2, the "Conforms to" field can be found under Recommended fields or Optional fields.
You can refer to a specification that you have uploaded or linked to via the Documents function in EntryScape.
Search for a specification using the search field or click on the magnifying glass to browse among specifications. Note that documents you have uploaded yourself must be of the document type "Standard/Recommendation/Specification" in Catalog to be visible here.
Named geographical area: The geographical area(s) for the dataset. Click on the magnifying glass to choose for example country, region, municipality or city.
Geographical area, Boundingbox: Choose area by zooming in and click on the map or write the coordinates, in reference system WGS 84 (latitude and longitude). Zoom in and out with the plus and minus buttons on the left side.

Click on the map marker to choose to pinpoint a location on the map, or click on the rectangle icon to choose to draw a rectangle around the chosen area for the dataset.

To draw a rectangle, click once to choose the upper left corner and click a second time to finish with the right lower corner of your chosen area. The coordinates update automatically in the fields on the right side.
Time period, Start and End: The time period to which the dataset applies, with start and end date. You can choose to add more than one time period. With the date menu to the right, you can choose if you want to enter only a year, or a date or a date and time. Then you enter the year/date/time in the left fields.
Access rights: Classification of the dataset, stating if it contains open data, data with access restrictions or non-public data, such as sensitive personal information. Note that descriptive metadata can be published for non-public data, but that distributions with the actual data should not be created for those datasets.
Optional fields
High-value dataset, category: If the dataset is categorized as a high-value dataset (e.g. "Heritage sites") and which category/categories it belongs to.
Temporal resolution: The minimum time period resolvable in the dataset, e.g. "Months: 3”.
Fee: If there is a fee associated with using the dataset.
Qualified related resource: An optional resource such as an image to illustrate the dataset or a showcase example of how the dataset can be used. Under “Role” you fill in the type of resource and under “Resource” you can add a URL to it.
Documentation: A page or a document about this dataset. Note that the document you refer to must be of document type "Documentation" in Catalog if you want it to be visible. You can read more about how to create and link documents to datasets in Documents.
Please note that the order in which documents are stored when you edit them in the EntryScape Catalog may not be the same order when the documents are presented.
Note! It can be tempting to work with EntryScape in several tabs open at the same time in a browser, but it is not recommended if you want to edit your datasets. If you accidentally edit the same dataset in two different tabs, it's easy to overwrite your own changes in the wrong way and cause error messages in EntryScape.
Edit dataset
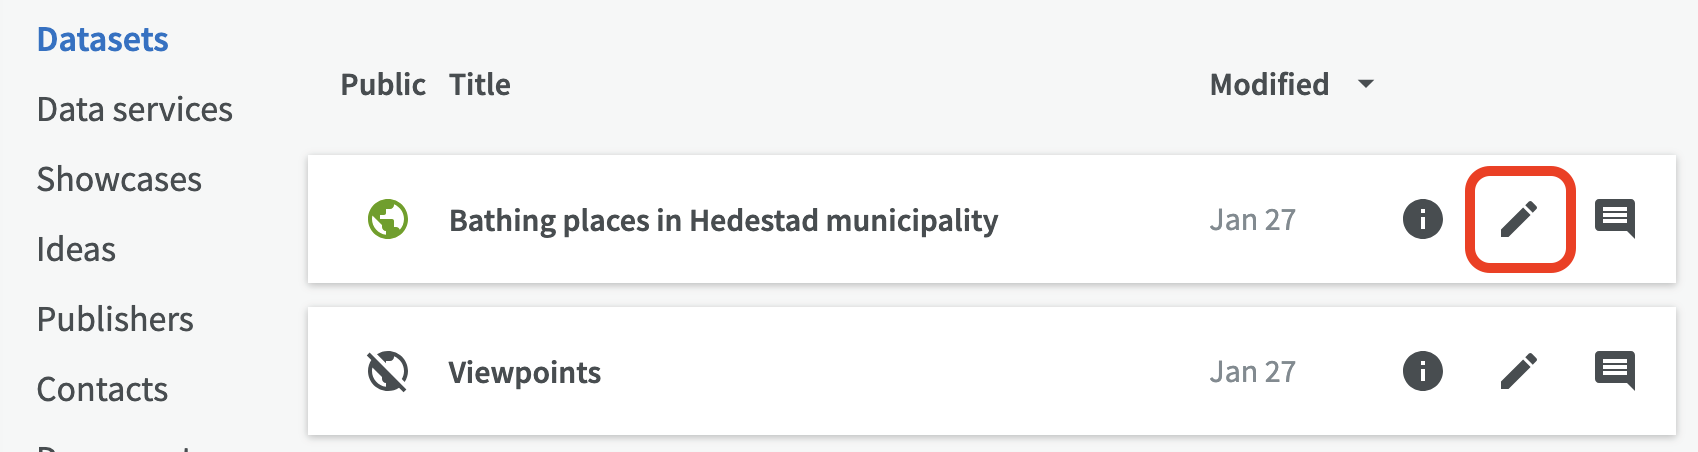
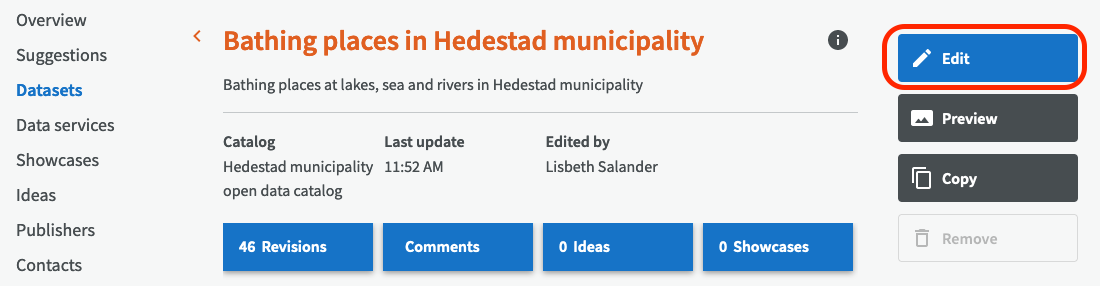
You can edit a dataset either by clicking on the edit pen in the list of datasets, or you can go to the dataset overview page and click the Edit button.
Lock dataset
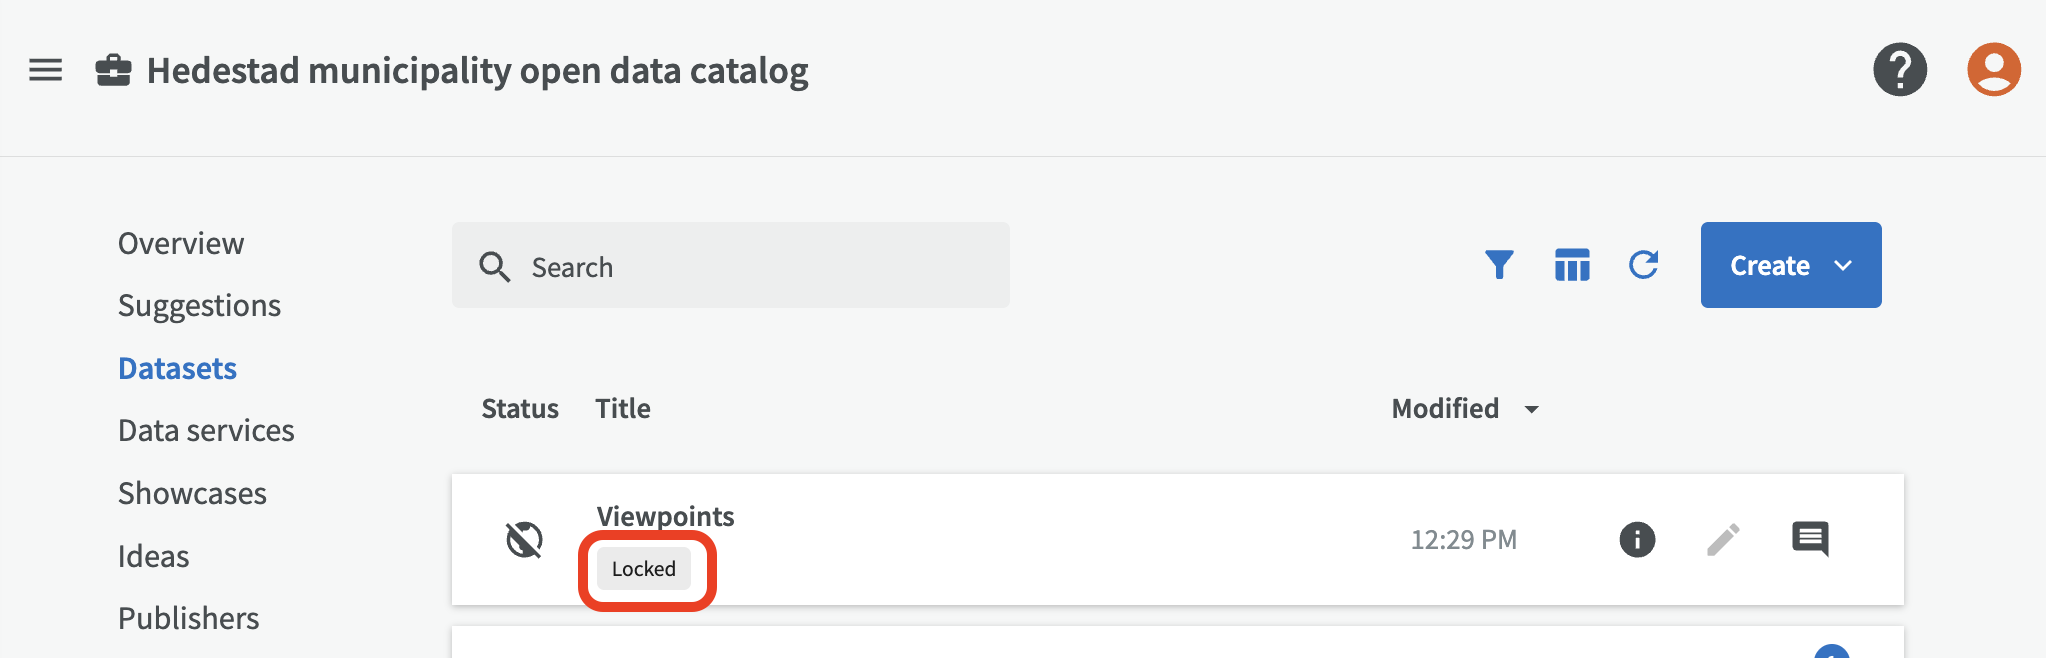
The lock function allows group administrators to lock data sets for editing. This is particularly useful when there are large amounts of data that are not intended to be changed in the future.
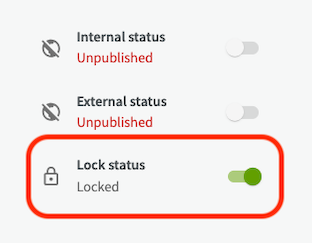
Locked datasets are indicated by a small lock icon in the dataset list.
Dataset series
DCAT-AP 3.0 introduces dataset series, which is also implemented in EntryScape 3.14. Dataset series can be used to group datasets that belong together, in time series for example. However, if you are still using DCAT-AP 2.x, dataset series will be disabled in EntryScape, until you upgrade to DCAT-AP 3.0 or later.
There are two different ways to create a dataset series:
-
Create a dataset series from an existing dataset. The advantage is that the dataset series is then automatically assigned values directly from the dataset, so you don't have to fill in many fields that should contain the same data as the datasets.
-
Create a dataset series from scratch, without any pre-filled values.
1. Create dataset series from an existing dataset
With this time-saving method, a number of the dataset's values are copied when you create the dataset series, such as publisher, keywords, category, applicable legislation, high-value dataset category, basic data category, conforms to, landing page, related resource, qualified related resource and documentation.
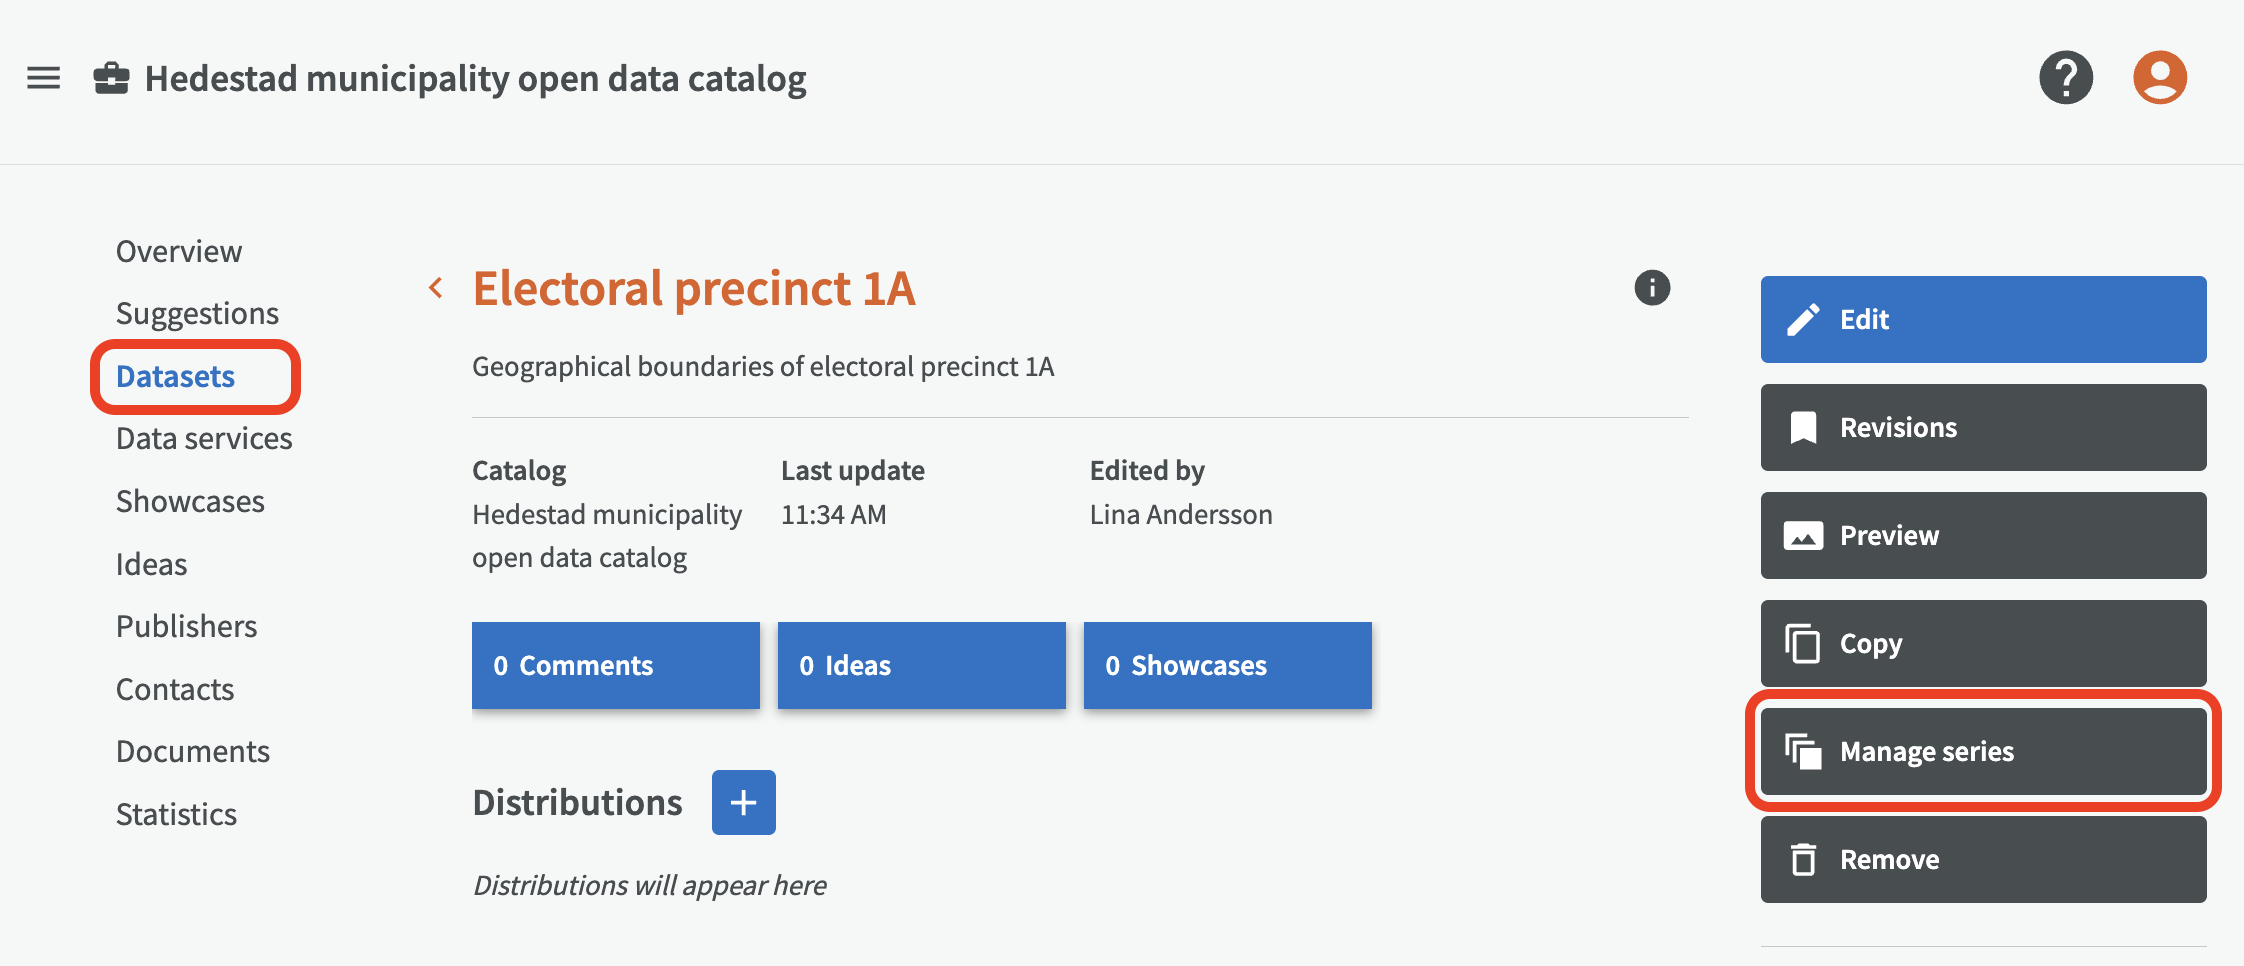
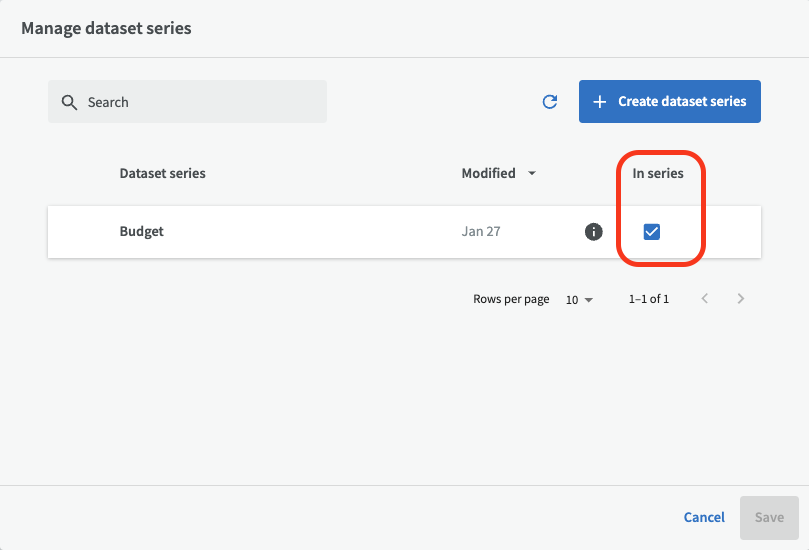
To create a dataset series from an existing dataset, go to Datasets, select the dataset to start from and click the button "Manage series".
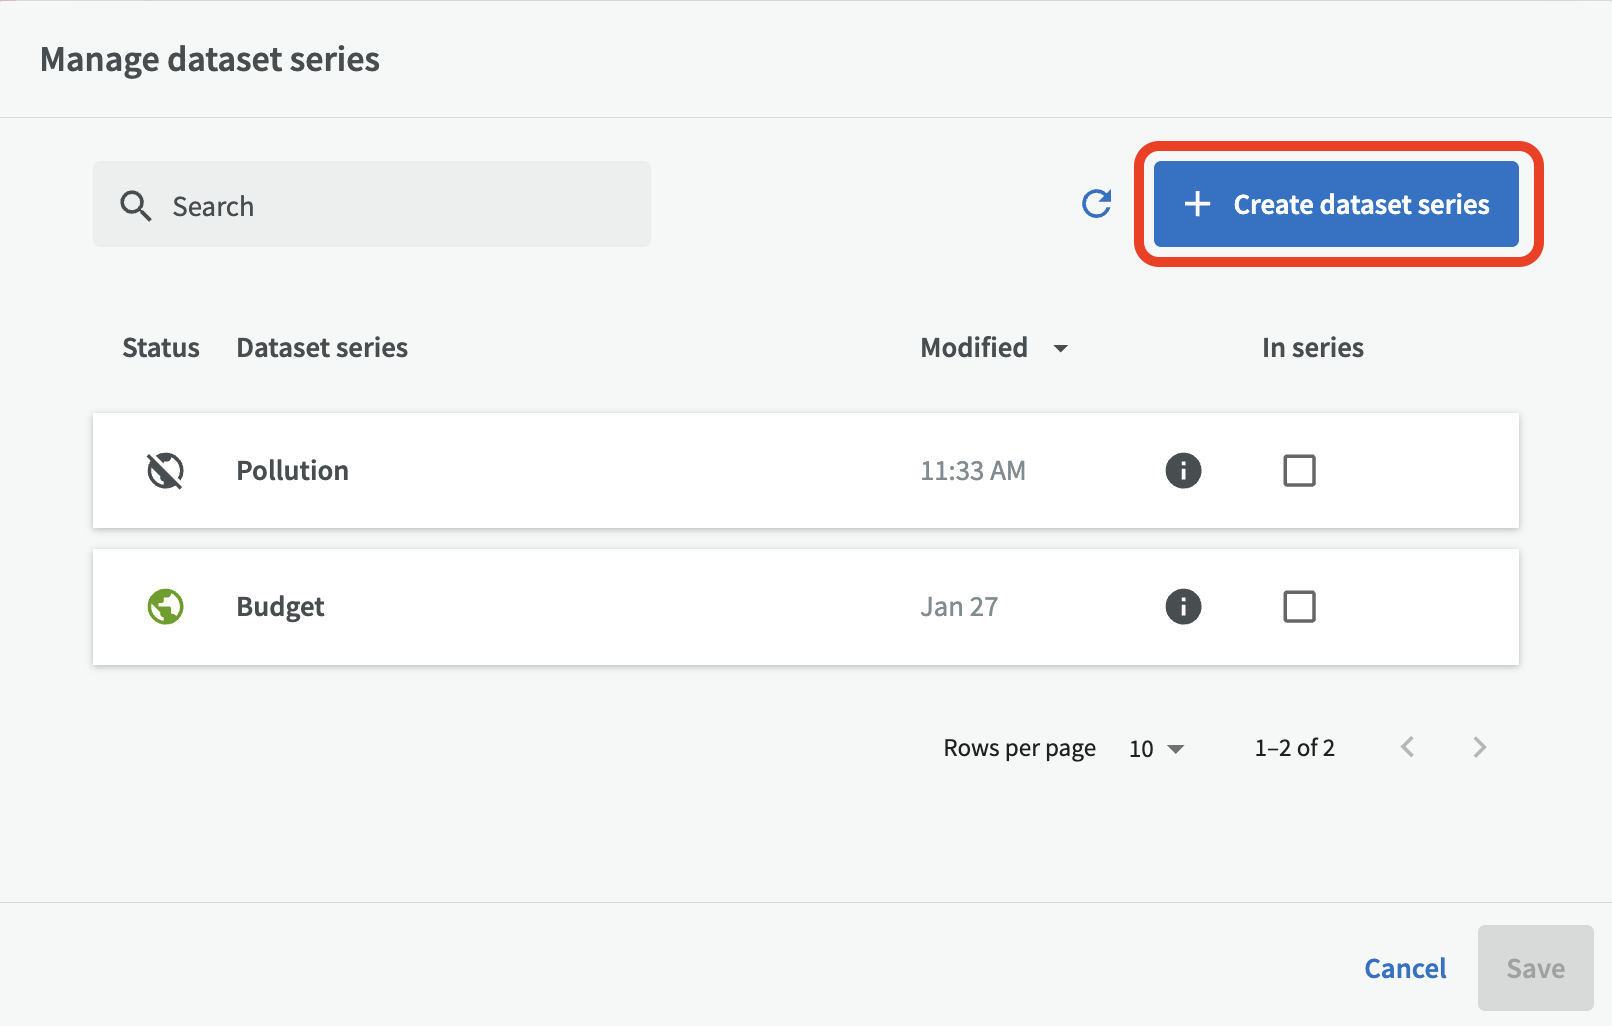
Then click the button "Create dataset series".
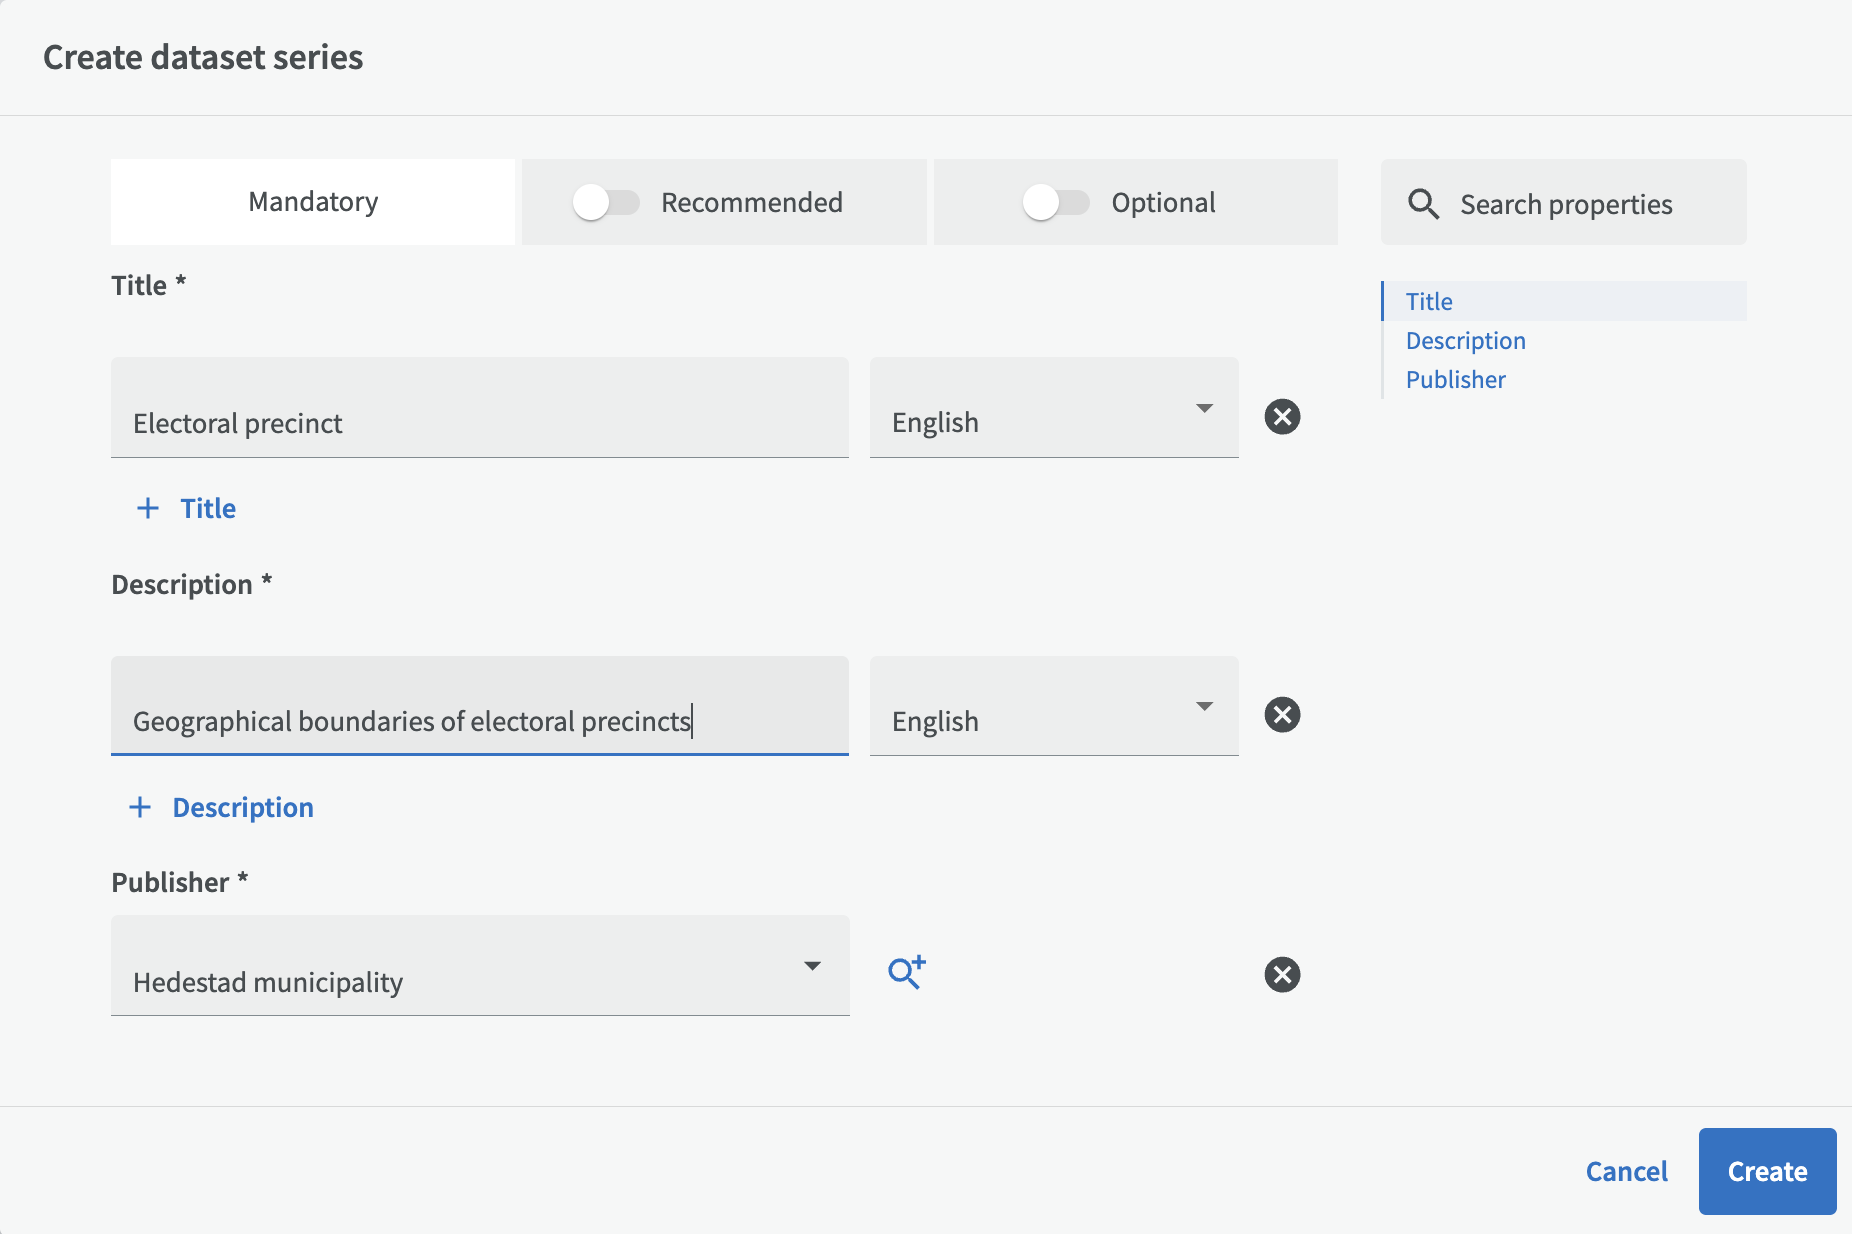
Many of the fields are already pre-filled (copied) from the dataset, but can of course be changed to better suit the dataset series.
It is also important to note that some of the fields that come from the dataset may need to be adjusted afterwards when the dataset series has been expanded with more datasets. This applies primarily to the fields Geographical area and Time period.
2. Create dataset series from scratch
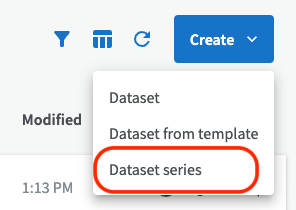
To create a dataset series from scratch, go to Datasets, click on "Create" and then select "Dataset series". Enter a Title, Description, Publisher, as well as other information and click on "Create".
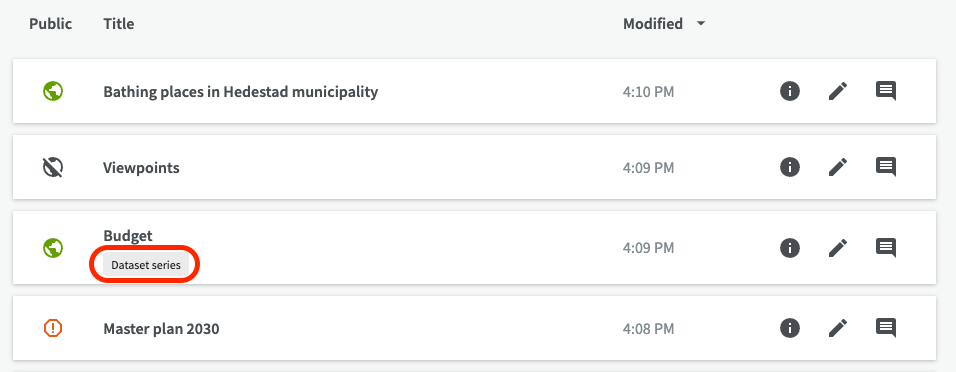
You will see your dataset series in the list of datasets, marked with a dataset series tag.
Adding datasets to a series
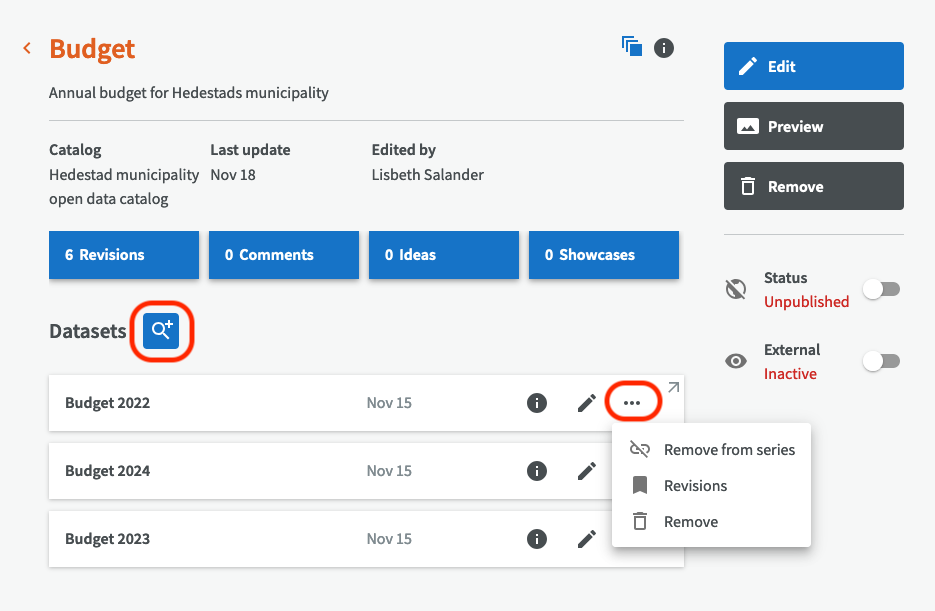
On the dataset series overview page, you can add datasets to your series by clicking the looking glass button next to "Datasets". And if you want to remove a dataset, you can click on the three-point menu for a dataset and choose to remove it from the series or remove it completely.
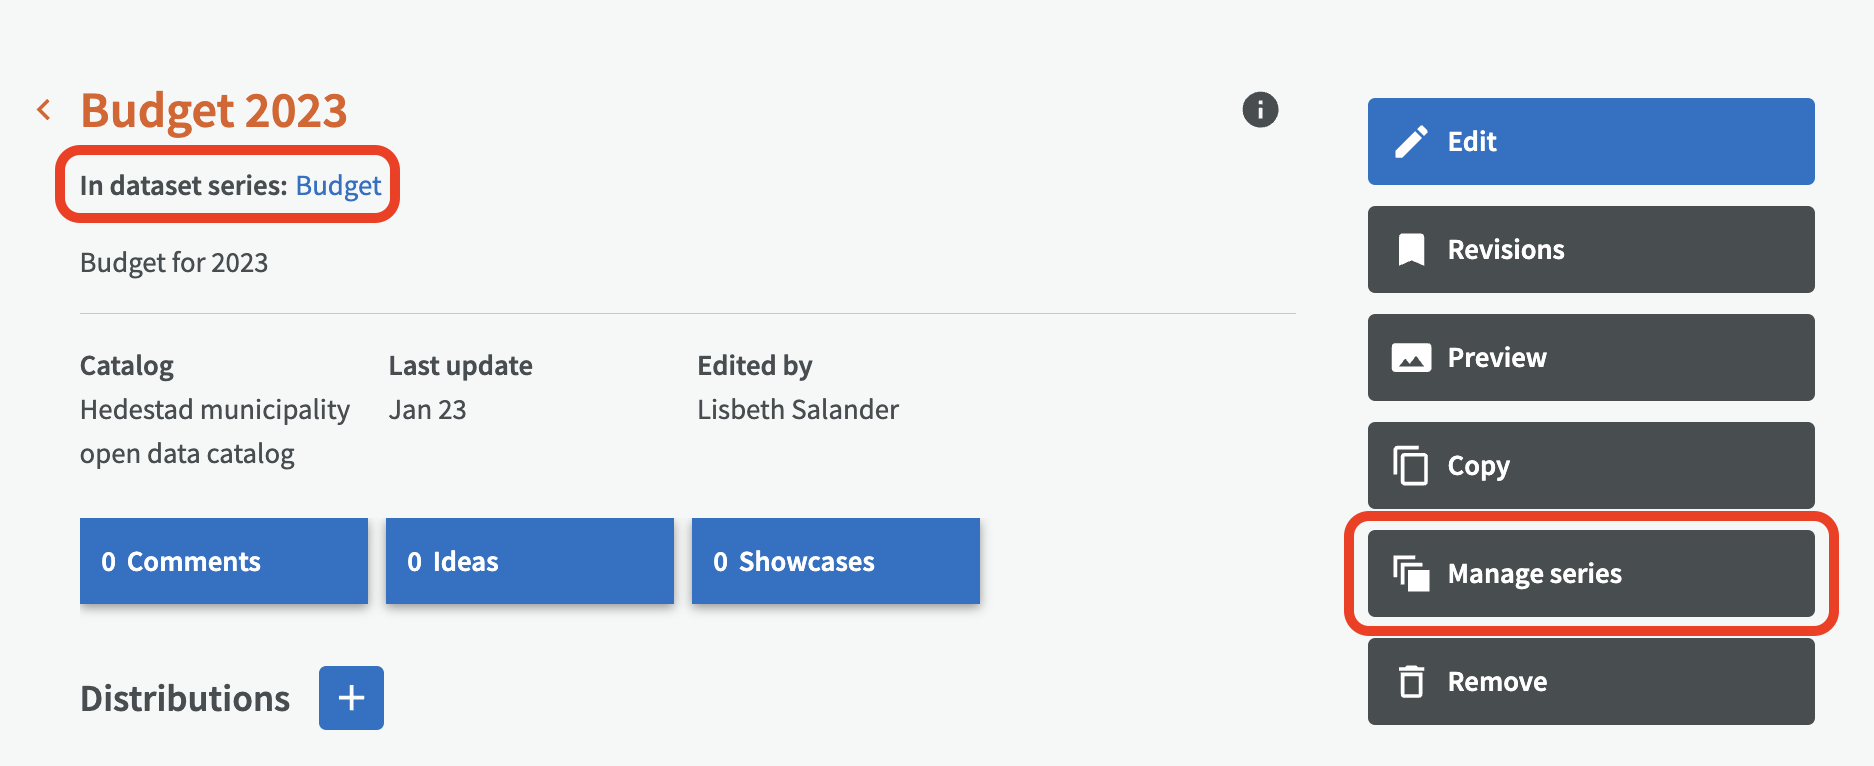
On the overview page for a dataset, you can also add or remove it from a dataset series by clicking the button "Manage series".
Note! Individual datasets that are part of a dataset series can not be published alone, but the whole dataset series must be published or unpublished altogether. If you want to be able to publish and unpublish individual datasets, please avoid organizing them into dataset series.
In general for dataset series, the "Conforms to" field, which describes what specification the dataset series conforms to, should be filled in for both the datasets and the dataset series. Read more about how to fill in the Conforms to field.
Create contact point
When you describe your dataset, you can also create a new contact point by clicking on the magnifying glass.
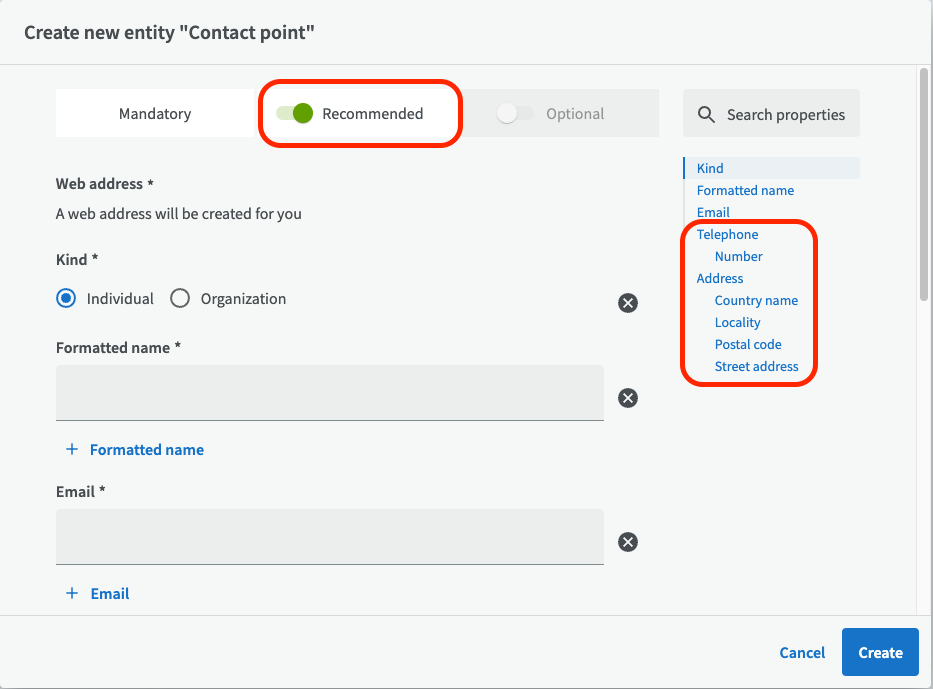
First choose whether you want to enter an organization (for example a department/unit) or an individual as contact point. Name and email are mandatory information, but if you choose to turn on recommended fields (at the top) you can enter more information such as phone number and address. Then click the Create button down to the right.
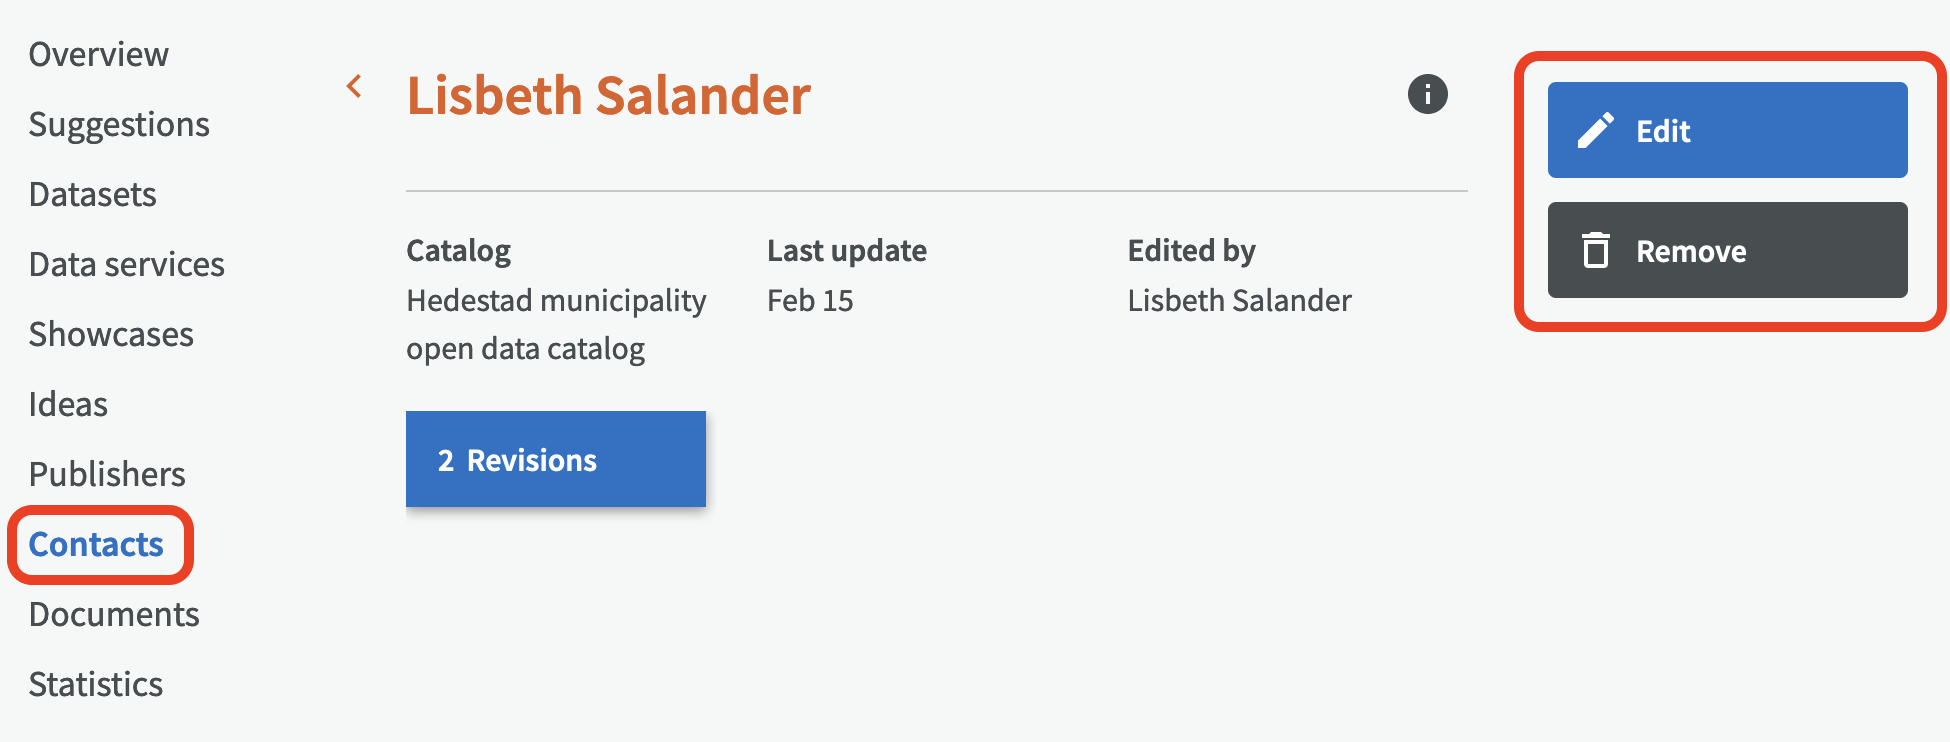
Note that you can't edit or remove an existing contact point here. Instead, go to Contacts in the main menu to the left. There you have full edit access to all contact points.
Copy dataset
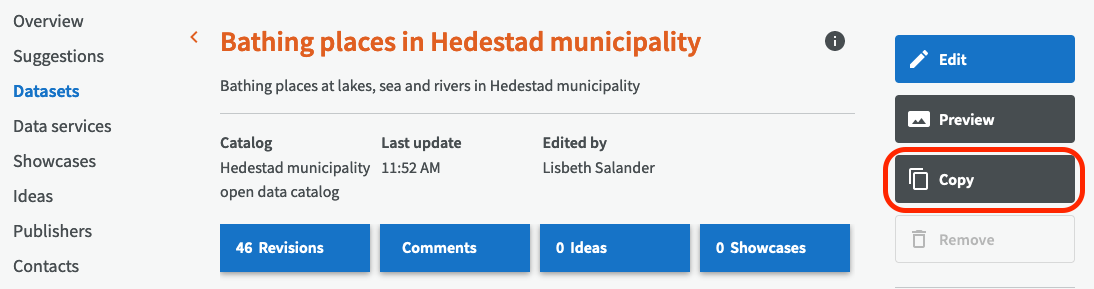
If you already have a described dataset that you would like to copy, go to the overview for the dataset and click on ”Copy”.
Then you can choose if you want to copy one or more distributions belonging to the dataset. Select the distributions you want to copy, and then click "Proceed". Please note that any visualizations or comments will not be copied.
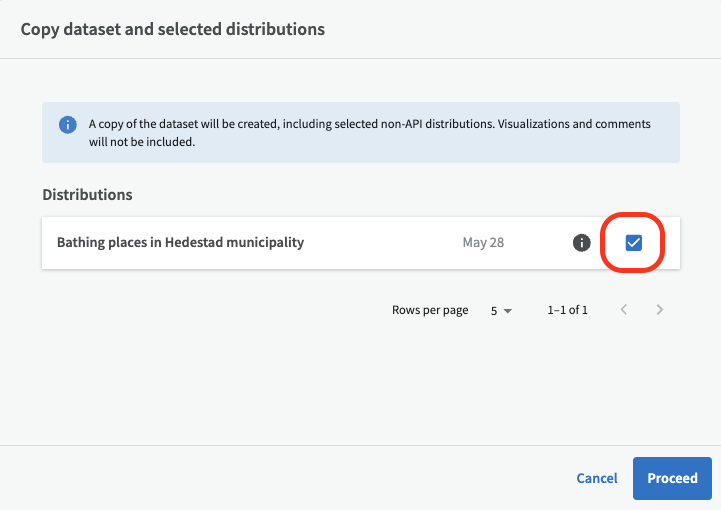
Table view and list view
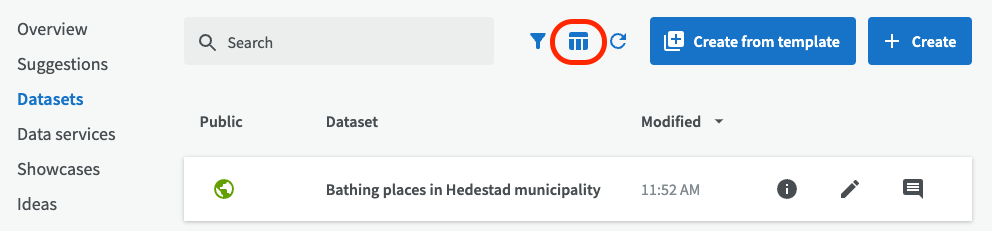
The default view in EntryScape Catalog is to show data in a list view. If you would prefer to see and edit many suggestions or datasets on the same page, you can use the table view. Change to table view by clicking on the table view icon at the top.
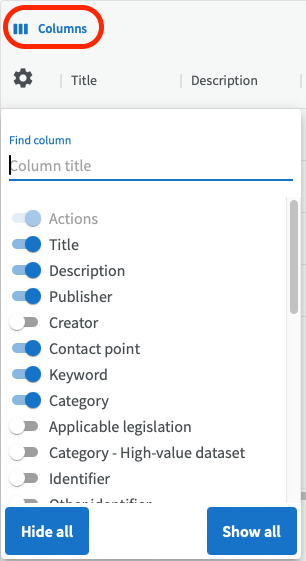
In table view, you can also decide how many columns you want to see simultaneously. Click on "Columns" to choose which columns to hide or show.
Please note that not all fields are available for display in table view, depending on the complexity of the field. This will be resolved in a future version of EntryScape.
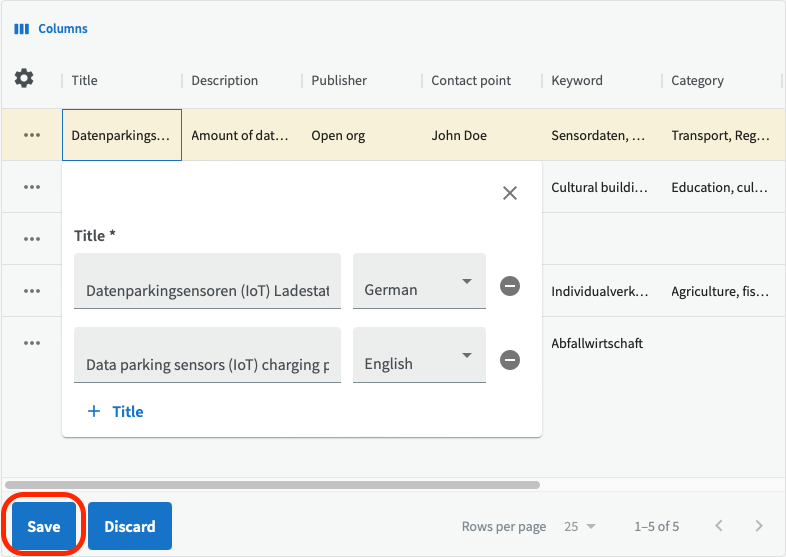
Click on the field you want to edit and describe it with a value from the drop-down list or free text. To close the edit box, click on the upper X or outside of the box. After you are done, don't forget to click on the Save button at the bottom.
To change back to list view, click on the list view icon up on the right.
See detailed information
If you want to see more detailed information about your dataset, click on the information icon.

Then you get a popup dialog where you can see metadata such as publisher, URI etc for your dataset as well as all entities linking to or from your dataset. Read more about detailed information.
Remove dataset
To remove a dataset, go to the overview for the dataset and click the button "Remove".
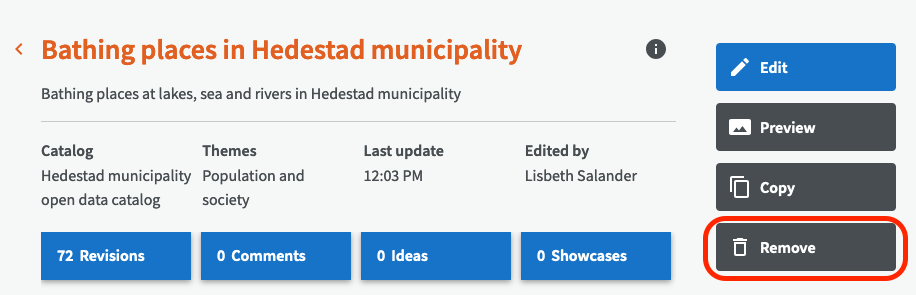
Note that you can only remove datasets that are unpublished, so if you wish to remove a published dataset you have to unpublish it first by click on the green publication slide button.

Publish dataset
Read more about how to publish catalogs and datasets on the page Publishing.